What 02GreenRule does
The 3-30-300 urban green rule (Konijnendijk 2023) measured in QGIS: every resident should see at least 3 trees from home, live in a neighbourhood with at least 30 % tree canopy and have a public green space within 300 m. The plugin counts trees in line of sight from the facade viewpoints of every home, maps canopy from open data, measures pedestrian-network distance to qualifying parks and reports population-weighted compliance, equity indicators and a scorecard per neighbourhood.
Line of sight from homes
Sight lines from facade viewpoints sampled over the building surface (Franklin & Ray 1994) to tree tops detected by variable-window local maxima (Popescu & Wynne 2004); optional visible greenness after Labib et al. (2021).
Open canopy sources
Meta/WRI 1 m canopy height, ESA WorldCover 10 m, Sentinel-2 NDVI with an Otsu or fixed threshold, or your own raster; canopy share per neighbourhood, home buffer or square grid.
Network distance, fair shares
Multi-source Dijkstra on the pedestrian network to parks from 0.5 ha or 1 ha; Lorenz curves and Gini, concentration index, quintile gaps, Theil decomposition and Gaussian E2SFCA park supply.
Install, then run the demo
In QGIS, open Plugins › Manage and Install Plugins, search for 02GreenRule and install it, or install a release zip with Install from ZIP.
QGIS 3.28 or later (QGIS 4 included). Only qgis.core, GDAL, NumPy and PyQt are needed; SciPy is used when present, with identical results without it. Online sources are read anonymously and cached in the QGIS profile, so a repeated run works offline. Visibility is measured from geometry: vegetation is not a sight obstacle and viewpoints sit on the facade.
Open the lab
Click the 02GreenRule toolbar button; the lab opens as a dock on the right.
Load the demo district
On Area, press Load demo district: a synthetic district in EPSG:32635 with 21 homes, a street grid, two qualifying parks, a garden that is too small, a private park, trees in open view, behind a 30 m wall and beyond the view radius, and two zones with 40 % and 10 % canopy.
Run all
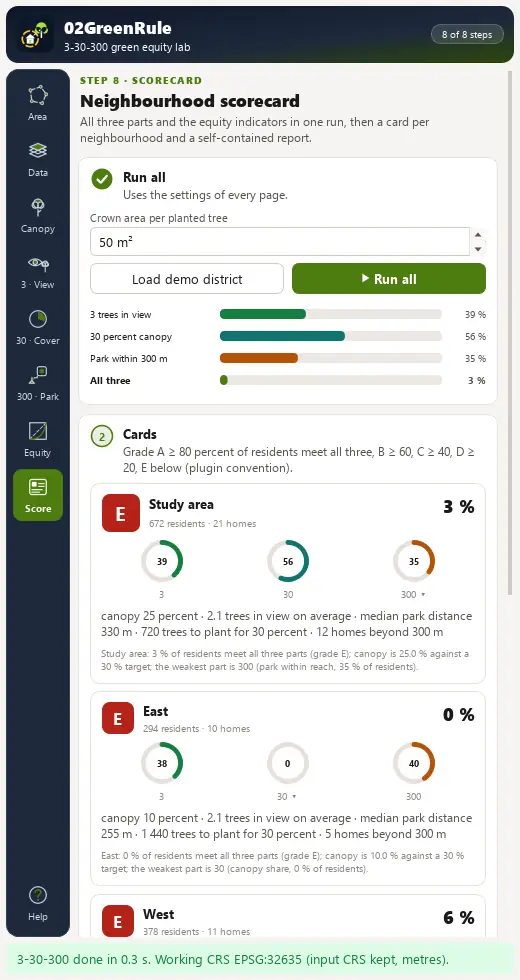
On Scorecard, press Run all. The study area card reads 39 % of residents passing 3, 56 % passing 30, 35 % passing 300 and 3 % meeting all three (grade E); the East zone needs 72 000 m² more canopy, about 1 440 trees.
Write the report
Press Write HTML report for the self-contained report. Every home carries its gap to the thresholds (trees_short, d300_over).
The lab dock, page by page
The lab is a dock on the right of the QGIS window with an icon rail of eight pages and Help. Long steps run as QGIS background tasks with a progress bar and a Cancel button.
| Page | What it holds |
|---|---|
| 1. Area | Study area from the map extent, a polygon layer or the neighbourhoods; area, padded area, cell size and the working CRS with the reason it was chosen; Load demo district. |
| 2. Data | Buildings, homes with residents, paths, parks, trees, park entrances, neighbourhoods and an optional terrain model; Fetch missing layers from OpenStreetMap. |
| 3. Canopy | Meta 1 m height, WorldCover 10 m, Sentinel-2 NDVI or your raster; canopy mask and tree tops. |
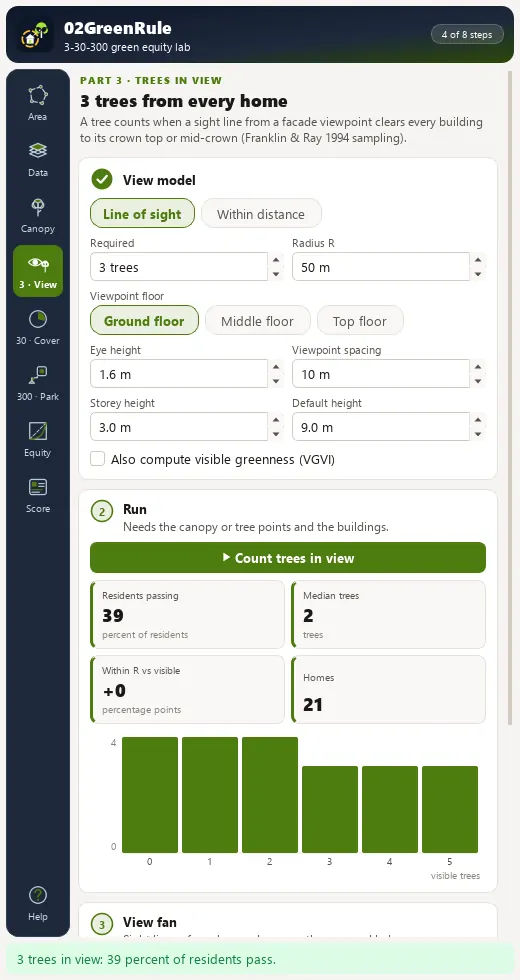
| 4. 3 · Trees in view | Line of sight or within distance, radius, viewpoint floor, eye height and spacing; a view fan of one home's sight lines on the map. |
| 5. 30 · Canopy | Neighbourhood as zones, home buffer or square grid; target and minimum valid share; histogram and a gauge per zone. |
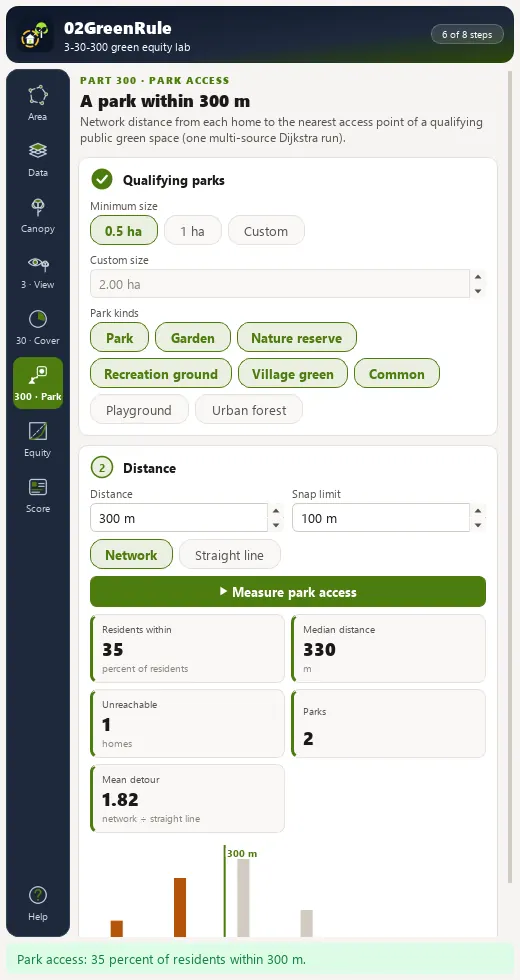
| 6. 300 · Park access | Minimum merged park size, park kinds, distance, network or straight line; median distance, unreachable homes and mean detour. |
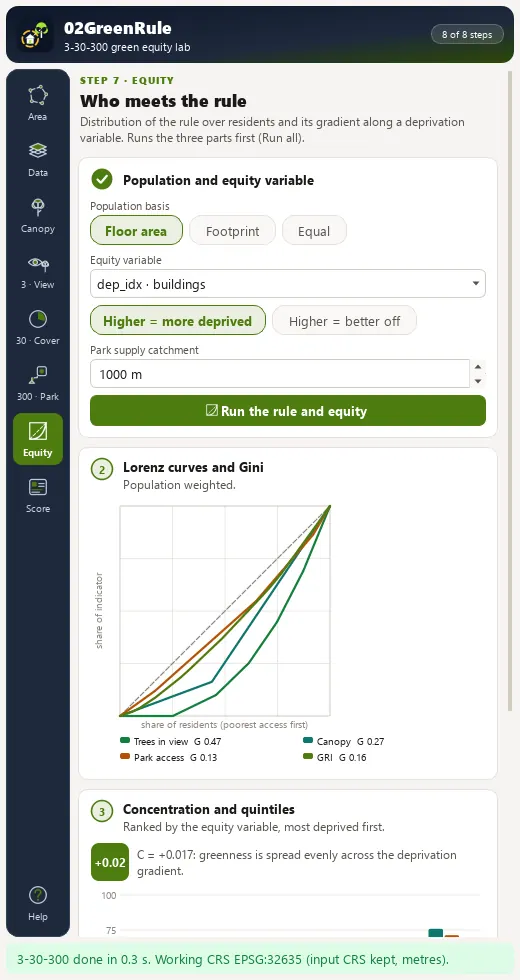
| 7. Equity | Population basis, equity variable and direction; Lorenz curves and Gini, concentration index, quintile bars, Theil split and E2SFCA park supply. |
| 8. Scorecard | Run all; a card per neighbourhood (grade, three gauges, trees needed, homes beyond 300 m), a ranked table, styled layers, HTML report, GeoPackage, CSV and canopy GeoTIFF export. |
Processing provider
The plugin registers a 02GreenRule provider with 9 algorithms in the Processing Toolbox, usable in models, batch mode and scripts.
| Group | Algorithm |
|---|---|
| Data and canopy | Fetch OpenStreetMap layers for an extent |
| Data and canopy | Canopy mask |
| Data and canopy | Detect tree tops |
| 3-30-300 rule | 3 - Trees in view from every home |
| 3-30-300 rule | 30 - Canopy share of each neighbourhood |
| 3-30-300 rule | 300 - Park access from every home |
| 3-30-300 rule | 3-30-300 rule (full run) |
| Equity and scorecard | Equity indicators |
| Equity and scorecard | Neighbourhood scorecard |
Full manual
02GreenRule manual
Every page and parameter, methods and formulas, output fields, the worked demo example, limitations and references.
Citation and licence
| Name | 02GreenRule - 3-30-300 Green Equity Lab |
| Package | zero2greenrule |
| Version | 0.1.0 |
| QGIS | 3.28 or newer; QGIS 4 supported |
| Licence | GPL-2.0-or-later (LICENSE) |
| Developer | Geophilo · Yusuf Eminoğlu (ORCID 0009-0005-6000-2934) |
| Source | gitlab.com/geophilo1/zero2greenrule |
| Issues | gitlab.com/geophilo1/zero2greenrule/-/work_items |
| Hub | plugins.qgis.org search: zero2greenrule (listing pending) |
| Revision | November 2026 |
Eminoğlu, Y. (2026). 02GreenRule - 3-30-300 Green Equity Lab (version 0.1.0) [QGIS plugin]. https://gitlab.com/geophilo1/zero2greenrule