The routine evidence base of a municipal transport office in one QGIS dock panel and in Processing: station catchments and 5D indicators, Bertolini's node-place model and a composite TOD index; traffic counts to AADT on road segments; motorised, pedestrian, bicycle and walkway level of service; and kerb-parking occupancy, turnover and pricing. No extra installs and no network requests.
Version: 0.1.1QGIS: 3.28+ / 4.xLicence: GPL-2.0-or-laterDeveloper: GeophiloLanguage: English
01 · Overview
What 02TODLab does
The routine evidence base of a municipal transport office in one QGIS dock panel and in Processing: station catchments and 5D indicators, Bertolini's node-place model and a composite TOD index; traffic counts to AADT on road segments; motorised, pedestrian, bicycle and walkway level of service; and kerb-parking occupancy, turnover and pricing. No extra installs and no network requests.
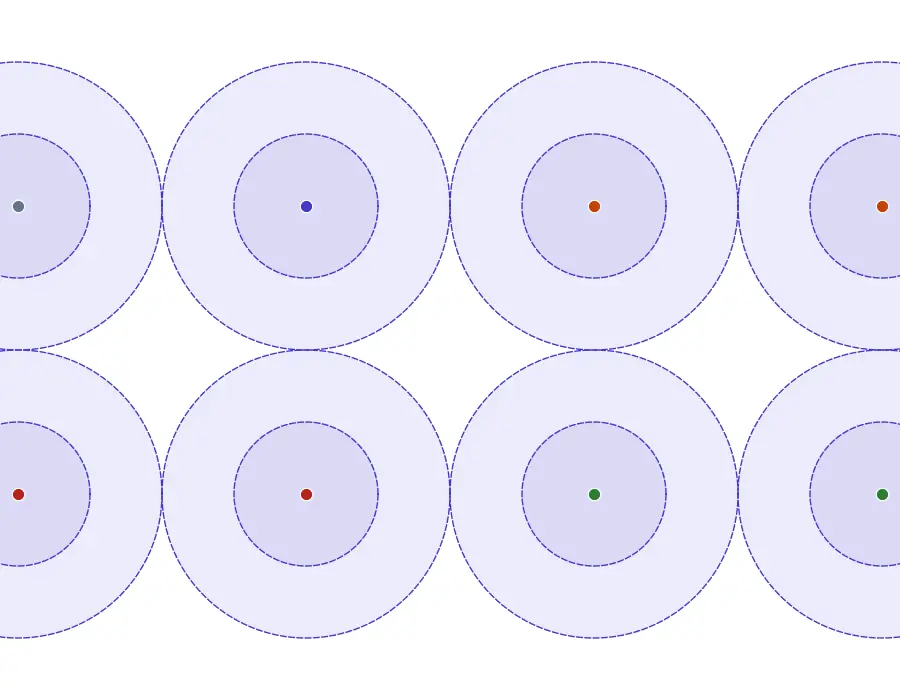
Station catchments of the demo district (400 m and 800 m buffers) with the stations styled by node-place class.
TOD
Stations and catchments
Euclidean buffers, network pedsheds or your polygons; density, diversity, design, destination accessibility and distance-to-transit; GTFS node indicators; node-place model; equal, manual, AHP or PCA weights.
Counts and AADT
From hourly counts to segments
Quality flags, AADT by the FHWA TMG 2022 hour-based procedure or AASHTO, factor groups, short-count expansion, K, D and PHF, and AADT on road segments with a log-linear model for uncounted links.
LOS and parking
Screening and surveys
Freeway and multilane density, urban street speed ratio and v/c; NCHRP 616 pedestrian and bicycle LOS; occupancy against the 85 % rule, turnover and overstay from hashed plates, demand-responsive pricing.
02 · Install and quick start
Install, then run the demo
In QGIS, open Plugins › Manage and Install Plugins, search for 02TODLab and install it, or install a release zip with Install from ZIP.
QGIS 3.28 or later (QGIS 4 included). NumPy ships with QGIS; nothing else is needed. The analytic core vendors five MIT-licensed packages by the same author (todindex, aadtkit, streetlos, parkingstudy, transitfreq). US-calibrated LOS models rank links relative to each other outside the US.
Click the 02TODLab toolbar button; the lab opens as a dock on the right.
Load the demo district
On Project, press Load demo district: 8 stations with residents, jobs, land use, streets, stops and a GTFS feed; 6 continuous and 4 short count stations with a full 2025 hourly table and 60 road segments; 12 block faces with hourly beats and hashed plate sightings, in EPSG:32635.
Run the modules
Run TOD, Counts & AADT, Level of service and Parking in turn; each takes a second or two.
Write the report
Open Report and write the HTML report or the GeoPackage. On the demo, continuous station C1 returns its planted AADT of 5 504.6 and the parking tables reproduce the planted occupancy, turnover and overstays face by face.
03 · The dock
The lab dock, page by page
The lab is a dock on the right of the QGIS window with an icon rail of 6 pages and Help. Long steps run as QGIS background tasks with a progress bar and a Cancel button.
Page
What it holds
1. Project
SI or US customary units, a badge with the working CRS, Load demo district and one status card per module.
2. TOD
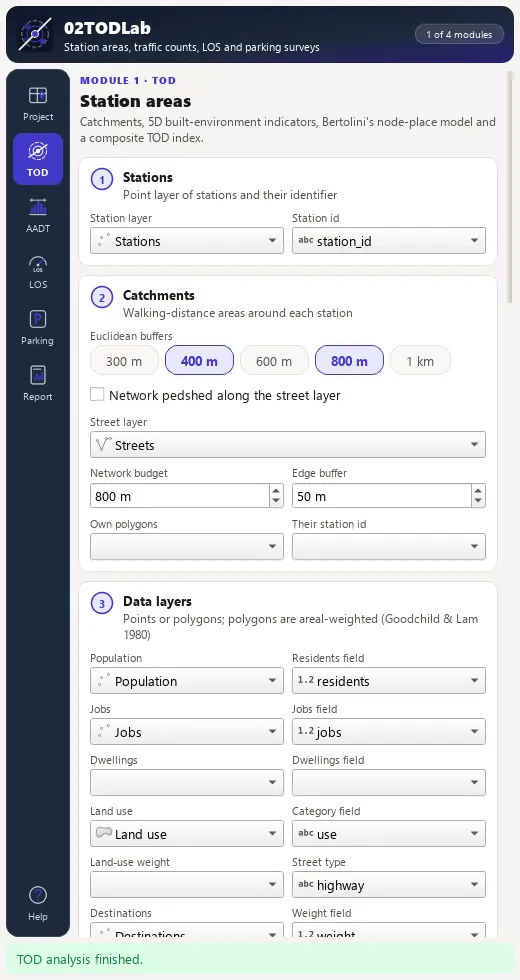
Stations, catchment radius chips, optional network pedshed or own polygons, data layers, a GTFS feed with service date and window, node and place indicators and composite weights; the AHP editor shows the consistency ratio live and refuses CR above 0.10.
3. Counts & AADT
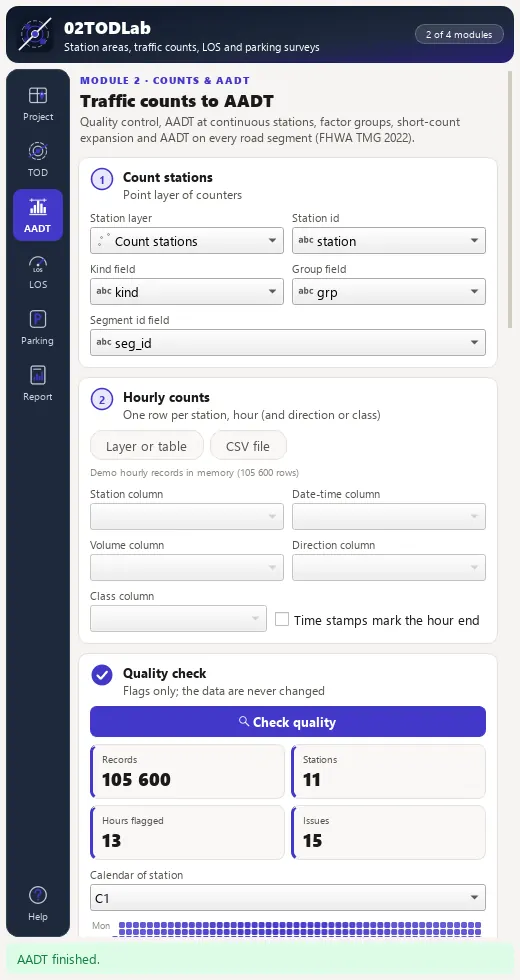
Count stations, the hourly table with a column mapping, quality flags with a calendar heat strip, the AADT method, factor groups, road segments and model covariates.
4. Level of service
Motorised LOS with a letter distribution, a map by letter and a table of LOS F segments; pedestrian and bicycle LOS with an override editor for every breakpoint table.
5. Parking
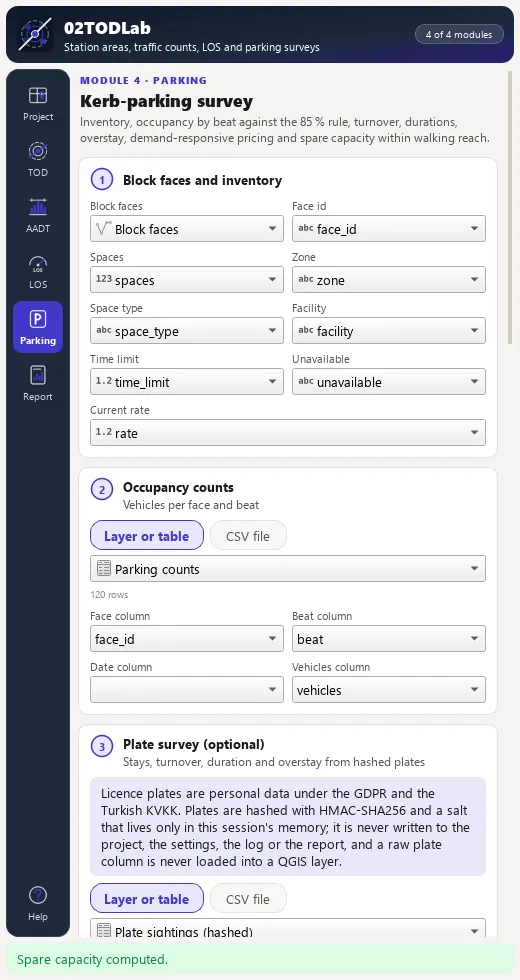
Block faces, inventory, occupancy counts and an optional plate survey (salt kept in memory only); accumulation curve, zone by hour heat map, recommended rates and a temporal occupancy layer.
6. Report
One self-contained HTML report, one CSV per result layer, or one GeoPackage with every layer.
TOD page of the 02TODLab dock with stations, catchments and data layers.Counts and AADT page of the 02TODLab dock.Parking page of the 02TODLab dock.
04 · Processing
Processing provider
The plugin registers a 02TODLab provider with 20 algorithms in the Processing Toolbox, usable in models, batch mode and scripts.
Group
Algorithm
TOD
Station catchments (buffers, pedsheds, polygons)
TOD
Station-area 5D indicators
TOD
GTFS node indicators per station
TOD
Node-place model
TOD
Composite TOD index
Traffic counts
Count quality control
Traffic counts
AADT at continuous count stations
Traffic counts
Seasonal factor groups
Traffic counts
Short-count expansion to AADT
Traffic counts
AADT on road segments
Level of service
Motorised level of service
Level of service
Pedestrian and bicycle level of service
Level of service
Walkway level of service
Parking
Parking occupancy and capacity
Parking
Parking turnover and duration (plate survey)
Parking
Demand-responsive parking pricing
Parking
Spare parking near destinations
Parking
Hash licence plates
Workflow
Demo district
Workflow
TOD and traffic lab (all modules)
05 · Companion Python SDKs (pip install)
Headless PyPI Counterparts for 02TODLab
Every analytical engine in 02TODLab pairs with standalone, MIT-licensed pure-Python packages in the 80-SDK Geophilo ecosystem (Station-Area TOD, Transit Frequency & Multimodal Mobility) for reproducible notebooks, batch pipelines and automated testing.