A plan from A to Z in one panel
02UrbanPlanning carries an urban plan from the first street to the last building inside QGIS. The planner draws only what a plan decides: road centrelines with their class, the plan boundary, division lines, land uses, overlays and facilities. Everything that follows from those decisions (streets, junction corners, kerbs, blocks, parcels, buildings, population, jobs and the plan balance) is built for you and rebuilt when a decision changes.
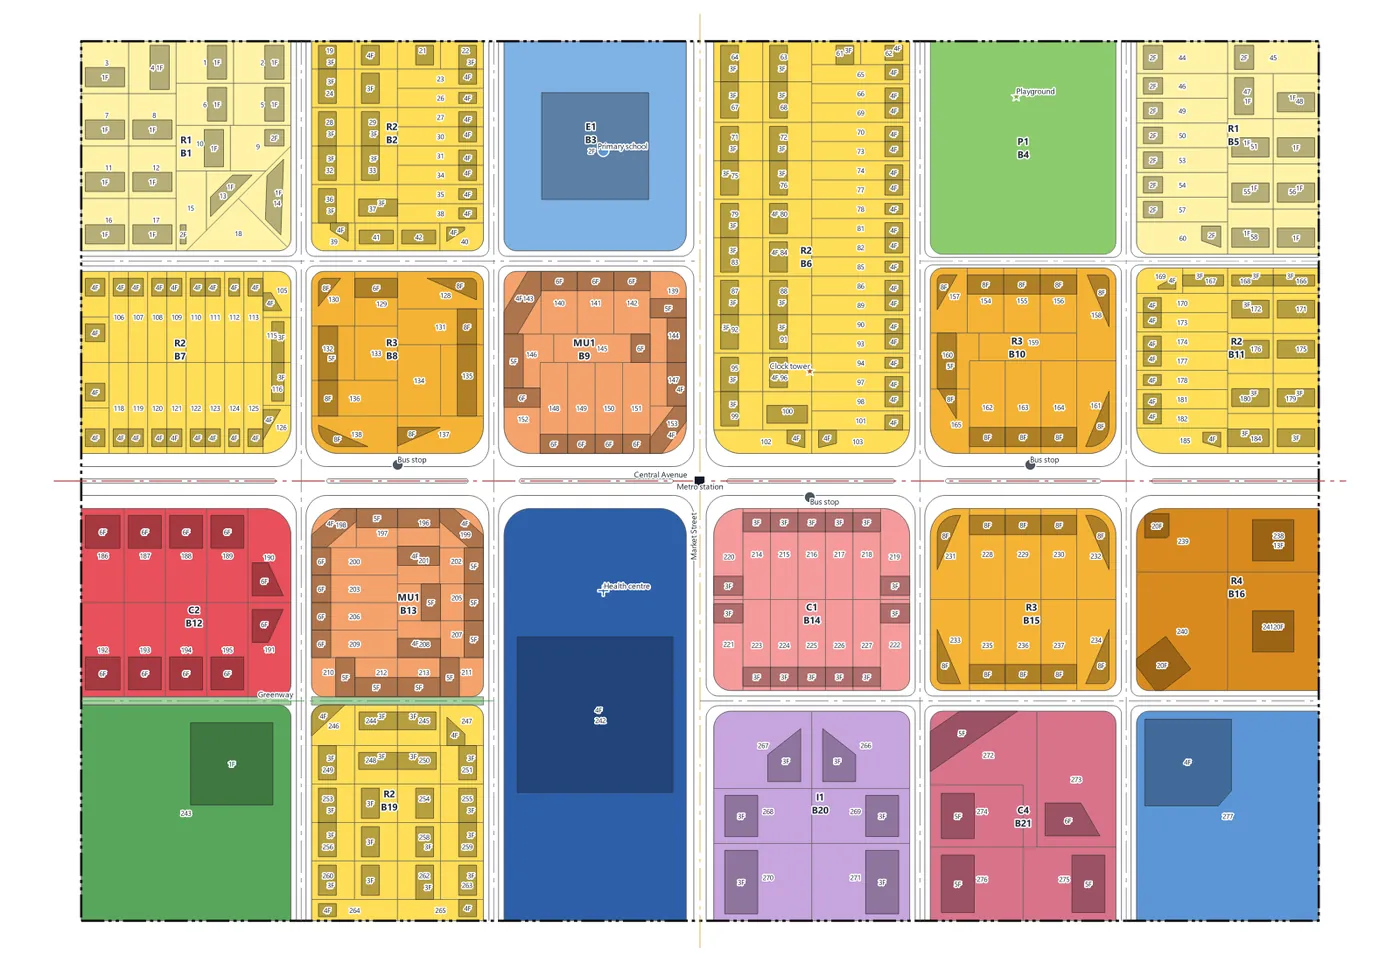
Draw centrelines only
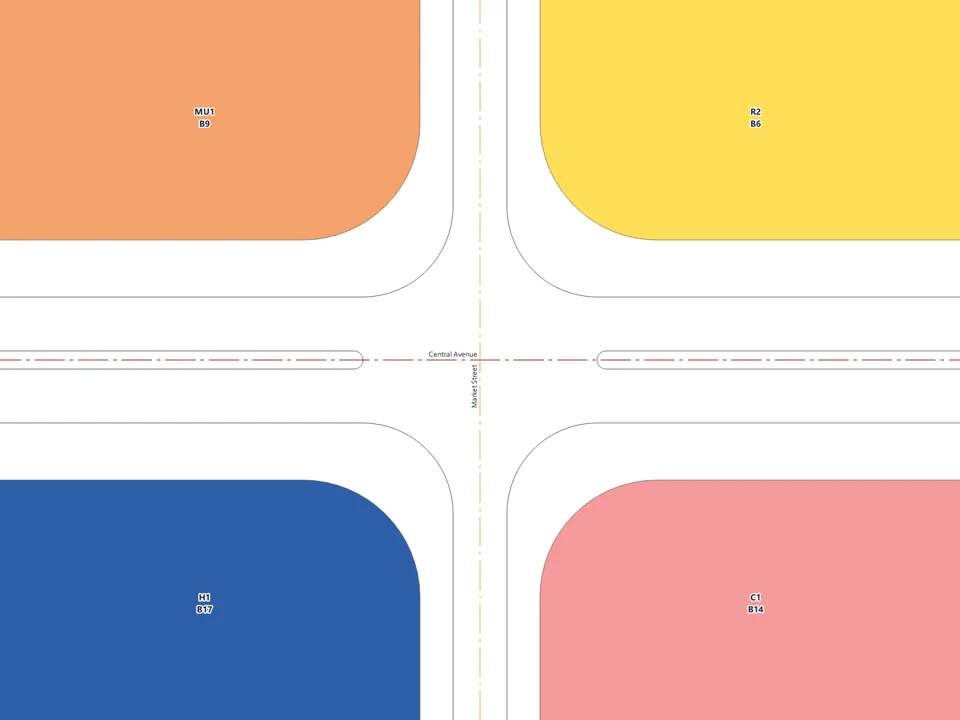
Right-of-way, junction corners rounded with the kerb radius plus the sidewalk, kerb lines, medians opened at junctions and the blocks between streets are built live.
Rules drive the plan
FAR, coverage, storeys, height, density, lot sizes, setbacks, typology, residential share and jobs per land use, edited in one window; a block value overrides its code.
Balance and targets
Land budget, population, dwellings, jobs, gross FAR, densities, amenity provision per 1,000 residents and the UN-Habitat (2014) neighbourhood targets.
The plugin works in any country and any language of plan: land-use colours follow the APA Land-Based Classification Standards (LBCS) colour families, road classes follow a functional hierarchy, and every number in the zoning code and the amenity standards is editable, so a local regulation replaces the defaults without code changes.
Install, then try a demo town
QGIS Plugin Hub
In QGIS open Plugins → Manage and Install Plugins…, search for 02UrbanPlanning and install. The plugin is marked experimental, so tick Show also experimental plugins in the Settings tab. Updates arrive through the same window.
Install from ZIP
Download the release archive and use Plugins → Manage and Install Plugins… → Install from ZIP. No extra Python packages are needed; the parcel engine is bundled.
The plugin adds a toolbar button and a Plugins → 02UrbanPlanning menu with three entries: 02UrbanPlanning studio (opens the panel), Zoning Code… and Manual (this page).
Your first five minutes
Open the studio
Click the toolbar button. The panel docks on the right with five pages behind an icon rail: Plan, Draw, Code, Balance and Output.
Press “Try a demo town”
On the Plan page, Try a demo town builds a 900 m × 640 m (58 ha) neighbourhood at the map centre with the same tools you use: plan boundary, an arterial spine (Central Avenue), a collector (Market Street), local streets, an access lane and a greenway; 22 blocks with land uses; a school, a health centre, bus stops, a metro station, a playground and a landmark; parcels and buildings. It is stored in a new GeoPackage in your temporary folder (zero2urbanplanning_demo/demo_town_N.gpkg) with a target population of 12,000.
Move a junction
On the Draw page (step 2), pick the Move junction / bend road tool and drag the crossing of Central Avenue and Market Street. Every road that meets there follows; on release the right-of-way, kerbs and blocks are rebuilt and every block keeps its land use.
Read the balance
Open the Balance page and press Refresh: plan area, population, dwellings, jobs, floor area, gross FAR, densities, the land budget, the UN-Habitat targets and amenity provision.
Start your own plan
On the Plan page enter a plan name, horizon year, target population, a GeoPackage path and a projected CRS in metres, then press Create plan. The panel switches to the Draw page: draw the boundary, then the streets.
Metric CRS required. Every width, setback, lot size and area is measured in metres, so a plan must use a projected CRS in metres. Geographic CRSs (degrees) are refused when the plan is created. The panel proposes the project CRS when it is projected, otherwise the UTM zone of the map centre.
The plan database: one GeoPackage
A plan is one GeoPackage. It holds three plan layers that share one code list, the development layers generated from them, the code tables every layer looks up, and the layer styles, so the plan opens styled in any QGIS. Copy the file and you have copied the plan.
Plan layers (what the planner decides)
| Table | Layer name | Geometry | Holds |
|---|---|---|---|
plan_zoning | Plan zoning | MultiPolygon | Blocks with their land use and number, generated streets (by road class) and overlays. Fields: block_no, land_use, origin (block, street, overlay), road_class, name, the block overrides far, coverage, max_storeys, max_height, density, typology, and phase, area_m2, notes. |
plan_network | Plan network | LineString | Road centrelines, the plan boundary, land-use division lines, overlay boundaries, railways, waterways, utility lines and the generated kerb lines. Fields: kind, road_class, row_width, carriageway, median, sidewalk, corner_radius, name, code, origin, notes. |
plan_points | Plan points | Point | Facilities, transit stops, landmarks, trees to keep and utility nodes. Fields: code, name, capacity, notes. |
Development layers (generated from the plan)
| Table | Layer name | Geometry | Holds |
|---|---|---|---|
plan_parcels | Parcels | Polygon | Lots subdivided from blocks: parcel_no, block_no, land_use, area_m2, frontage (length on a street, m), flag (for example whole block for a public use kept as one lot). |
plan_buildings | Buildings | Polygon | Building footprints: building_no, parcel_no, block_no, land_use, typology, storeys, height, footprint, gfa (gross floor area), dwellings, population, jobs. Extruded by height in a 3D map view. |
Code tables (the unified database)
| Table | Holds |
|---|---|
plan_zoning_code | One row per land use: code, name, family, fill (colour) and every zoning rule of section 6. Filled from the catalogue defaults when the plan is created. |
plan_amenity_standards | Provision standards: key, name, ha_per_1000 (hectares per 1,000 residents), walk_m (walking distance) and codes (the land uses that supply the amenity). |
plan_settings | Key/value plan settings: plan name, horizon year, target population, household size, dwelling size, planning authority, author, and the switches for clipping at the boundary, kerb lines and live rebuild. |
Unit and extension tables
| Table | Layer name | Holds |
|---|---|---|
plan_units | Planning units | Neighbourhoods, districts, sectors, superblocks and delivery phases drawn over the blocks: unit_no, name, kind, notes (section 14). |
plan_junctions | Junction solutions | Point table for junction designs (solution, params, name, notes), created in every plan. |
plan_site | Site plan | Polygon table for site elements of a lot (kind, parcel_no, block_no, land_use, area_m2, spaces, height, notes), created in every plan. |
The layer tree groups the layers under the plan name in draw order, top first: Plan points, Junction solutions, Plan network, Buildings, Site plan, Parcels, Planning units, Plan zoning. Reload layers on the Plan page adds any plan layer missing from the project, and a plan made with an older version gains the tables a newer version expects when it is opened.
The studio panel
The panel has a header with the plan name and horizon and an icon rail with five pages. A Save edits button appears in the header whenever a plan layer has unsaved edits; it writes every pending edit of the plan layers to the GeoPackage. The ? button at the foot of the rail opens this manual.
| Page | What it does |
|---|---|
| Plan | New plan (name, horizon year, target population, GeoPackage, CRS in metres; Create plan or Try a demo town), Open a plan (an existing 02UrbanPlanning GeoPackage), Current plan (file, feature counts and the buttons Zoom to plan, Reload layers, Restyle all, Rebuild network) and a short How a plan is made guide. |
| Draw | The whole plan in eight numbered steps: plan area, streets, land use, overlays, points, parcels, buildings and a live balance (section 5). |
| Code | A read-only summary table of every land use (colour, code, use, FAR, coverage, storeys, typology) and the button Open the Zoning Code… (section 6). |
| Balance | Key figures, the target-population check, the land budget, the UN-Habitat targets and amenity provision (section 12). |
| Output | Plan sheet (print layout and PDF), HTML plan report and Save a copy of the plan… (section 13). |
Restyle all re-applies the catalogue styles (land-use colours, road-class lines, point markers, labels, value maps for coded fields, read-only generated fields and the 3D extrusion of buildings) and saves them as the default style in the GeoPackage.
Draw, step by step
The Draw page carries the plan in numbered steps. Every step follows the one before it: move a road and the blocks, their land use and the balance follow.
1 · Plan area
The plan boundary closes the blocks at the plan edge.
- Draw the plan boundary: click the corners, right-click to close. A new boundary replaces the current one.
- Boundary from selection: select polygons on any polygon layer (made active) and their outline becomes the plan boundary, reprojected to the plan CRS.
- Clip streets at the boundary (on by default): the right-of-way, kerbs and street length stop at the boundary. Without a boundary, blocks are the areas the streets enclose.
2 · Streets
Pick a road class from the chips (each shows its right-of-way in metres), check the cross-section, and draw centrelines. Right-of-way, junction corners, kerbs and blocks are built for you.
- Road class chips: Expressway 60, Arterial 40, Minor arterial 30, Collector 20, Local 15, Access lane 10, Pedestrian 10, Greenway 6 (see section 8). The tooltip lists the right-of-way, carriageway, sidewalks, median, kerb radius and design speed.
- Cross-section: a live drawing of the section and five fields: ROW (property line to property line), Carriageway (both directions), Median, Sidewalk (each side) and Kerb radius (the block corner gets the kerb radius plus the sidewalk). A new road takes these values; every road keeps its own widths in the network layer.
- Draw road: click points; they snap to roads and the boundary. Shift locks the angle to 15° steps, right-click or Enter writes the road, Backspace removes the last point, Esc clears. Where the new road meets or crosses existing roads a shared vertex is inserted on both, so the junction is real.
- Draw curved road: start, a point on the curve, end; the third click writes a circular arc.
- Move junction / bend road: drag a junction and every road vertex there moves together; drag a road elsewhere to bend it at a new vertex. Blocks follow on release.
- Apply class to selected roads: gives the selected centrelines the class and cross-section above.
- Undo the last road edit (the same as Ctrl+Z on the network layer) and Rebuild now.
- Rebuild while editing roads (live rebuild, on by default) and Kerb lines (on by default). A status line reports roads, junctions, blocks, blocks without a use, street length and the rebuild time.
Road edits go into the layer's edit buffer, so they can be undone and are written to the GeoPackage with Save edits. Generated kerbs are written straight to the file and never enter the undo stack.
More street tools
- Draw road with rounded corners (next to the curved road): click the corner points as for a straight road; every corner becomes a tangent arc of the Corner radius (default 30 m), and a short segment takes the largest radius that fits.
- Dead ends: None, Turning circle or Hammerhead at every road end that stops inside the plan, sized by the road class: circles of 8–14.6 m kerb radius, hammerheads with 12–18.3 m arms. 14.6 m and 18.3 m are the fire-apparatus turnarounds of the International Fire Code, Appendix D; the smaller sizes are working defaults for refuse trucks. Roads that end on the boundary or run out of the plan get no head.
- Right-of-way width labels: writes the width (20 m) on the centrelines, once per connected group of roads of the same width; road names are kept.
2b · Junctions
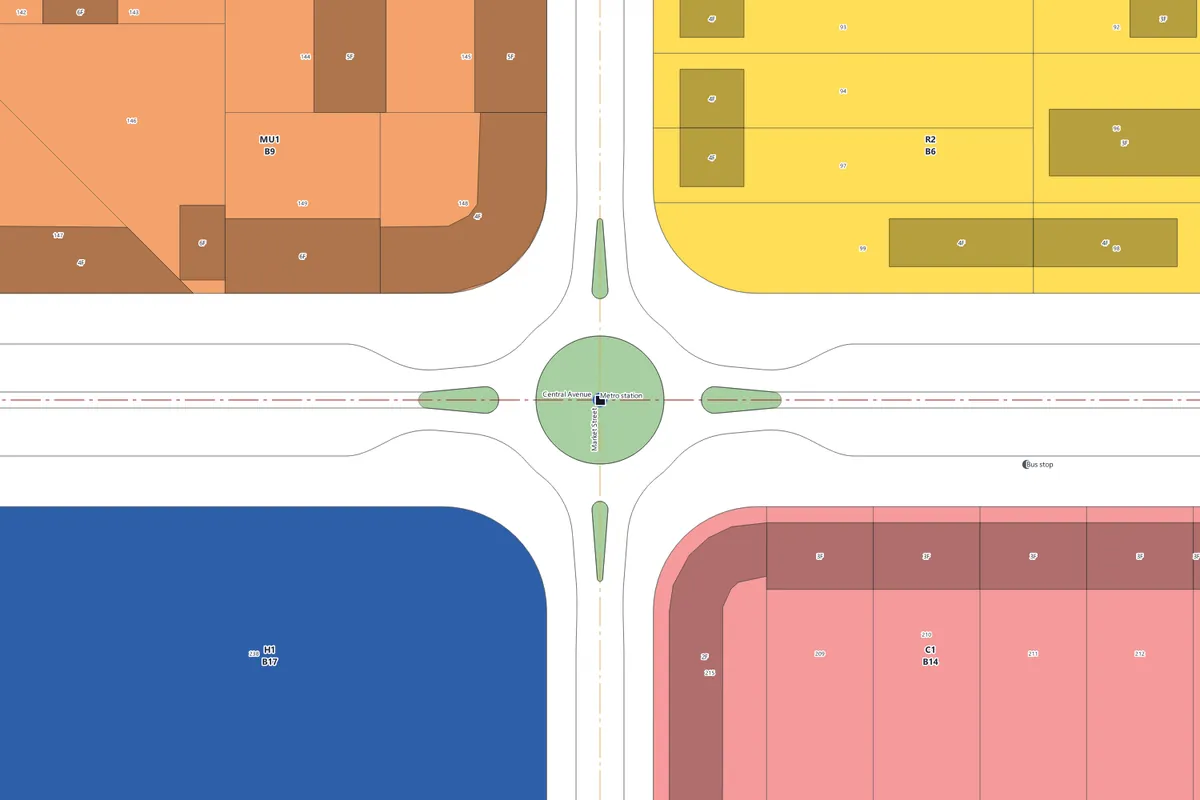
Every junction is first built as an ordinary crossing with rounded corners. Pick a solution from the icon row, then click a junction: a small window shows its parameters with plausibility notes and the source of the defaults, and the solution is stored in plan_junctions. It is rebuilt with the plan and follows the junction when it moves; it goes away when the junction does, and comes back with an undo. A click away from a junction (where fewer than two roads meet) is refused with a message. Remove solution makes a junction an ordinary crossing again. Details and default values in section 8.
Under the buttons the section reports the number of solutions and one warning line for junctions that are too close along a class (for example 5 arterial junctions closer than 200 m); Show zooms to them and selects their roads.
3 · Land use
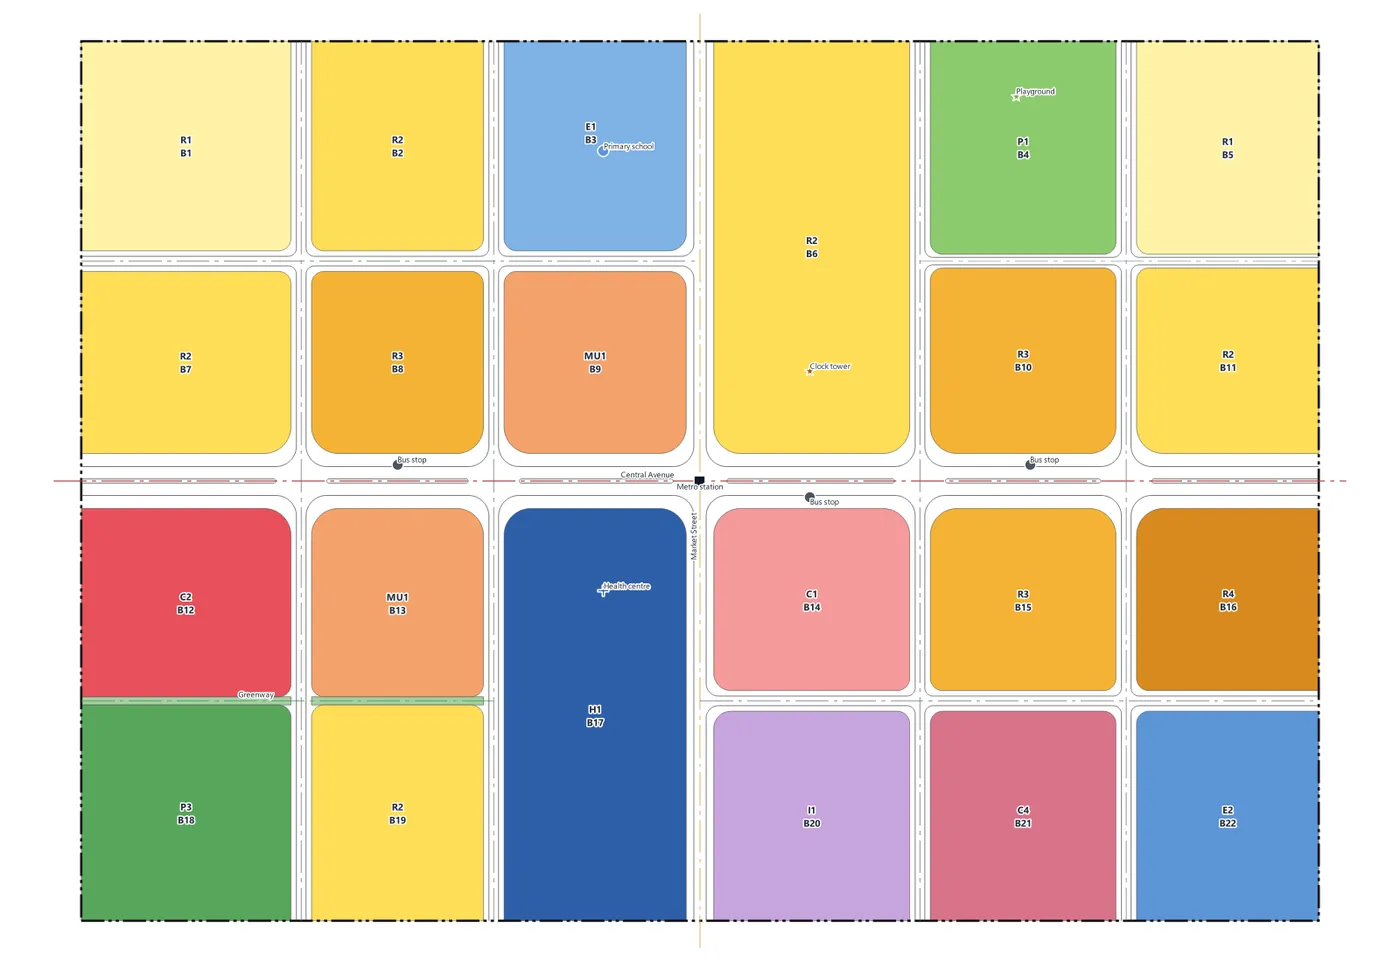
Pick a use from the palette (grouped by colour family), then click or drag across blocks: every block the cursor crosses takes the use. Blocks that still need a use are drawn with an orange dashed outline. The tooltip of each swatch shows the code, the name, the description and the main rules (FAR, coverage, storeys, density, typology).
- Apply to selected blocks: gives the chosen use to the blocks selected on the zoning layer.
- Split a block: draw a division line across a block. It may stop a little short of the edges (it is extended by 2.5 m). Both parts keep the use; give one of them another.
- Number blocks: numbers blocks from top-left to bottom-right and keeps existing numbers; Shift+click renumbers every block. Block labels read the land-use code and the number (for example R2 / B7).
- Clear the use of the selected blocks.
Changing a block's land use clears the rule overrides typed on that block (FAR, coverage, storeys, height, density, typology), because they belonged to the old use.
Style painter
Three buttons under the palette copy a block's decisions to other blocks. Pick a block's style (eyedropper): click a block and its land use and rule overrides (FAR, coverage, storeys, height, density, typology) become the brush. Paint the picked style: click or drag across blocks and they take that land use and those overrides. Copy rules to the selection: only the overrides go to the selected blocks; each keeps its own land use.
3+ · Drawing aids
Construction helpers under the land-use step. Lines go into the network through the edit buffer, so Ctrl+Z undoes them and the blocks follow. Draw as sets whether parallel, perpendicular, angle and offset lines become roads (with the class of step 2) or division lines; Distance (default 60 m, 0 = follow the cursor), Strips (with across) and Angle snap (off, 5°, 15°, 30°, 45°, 90°) set the aids.
| Aid | Use |
|---|---|
| Parallel road | Click a road, then the side: a new line at the set distance (0 = through the second click). |
| Perpendicular | Click a road, then a point: a line at right angles from the point to the road; click on the road itself for a stub of the set distance. |
| Extend / trim | Click near a line end: it runs on to the next road or the boundary, or a short overshoot past a crossing is trimmed. |
| Line with angle snap | Segments lock to the direction of the nearest road plus the angle step; right-click or Enter writes, Shift frees the angle. |
| Measure | Live length, bearing and enclosed area; nothing is written. |
| Rectangle plaza | Two corners of one edge, then the depth: the plaza is cut out of the block and gets the palette's use (Plaza, P4, if none is picked). |
| Circular plaza | Centre, then a point on the edge. |
| Divide a block | Click a block: division lines split it into the set number of strips of equal area, across or along its long side. |
| Offset the plan boundary | Writes the boundary moved inwards by the distance, as a ring road or an edge division line. |
U · Planning units
Neighbourhoods, districts, sectors or quarters, superblocks and delivery phases over the blocks, each with its own population, homes and jobs. Give a name (optional) and a kind, then Draw a unit (click the corners, right-click closes) or Unit from selected blocks (the selected blocks and the streets between them become one unit). Number units numbers them top-left to bottom-right (Shift+click renumbers all), and Unit balance fills a table of area, people, homes and jobs per unit (buildings where they exist, otherwise the zoning-code capacity). Every block belongs to the unit it overlaps most; click a row to go to the unit.
4 · Overlays
Overlays are boundaries over the land use: heritage, hazard, phasing and special areas. Pick an overlay, then draw its area on the map (right-click closes). Overlays are stored in plan_zoning with origin = overlay, drawn above the land use with a dashed outline and a light diagonal hatch in the overlay colour, and never change the land budget. The ten types are listed in section 9.
5 · Points
Facilities, stops and landmarks: pick a type and click on the map (clicks snap to the network). Each point gets the type's name, which you can edit. The 21 types are listed in section 9.
6 · Parcels
Blocks are subdivided by the lot width, lot area, depth and frontage of their use with the bundled ParcelFlux engine; public uses become one lot per block. Choose Every block with a use or Selected blocks, the Width variation (0–40 %, lot widths vary randomly by ±that share) and the Seed (same seed, same parcels), then press Generate parcels. Details in section 10.
7 · Buildings
Setbacks, site coverage, FAR, storey and height caps and the typology of each use shape the buildings; residents and jobs are counted on them. Choose Every parcel, Selected parcels or Parcels of selected blocks and press Generate buildings. 3D view opens a 3D map view in which buildings are extruded by their height. Details in section 11.
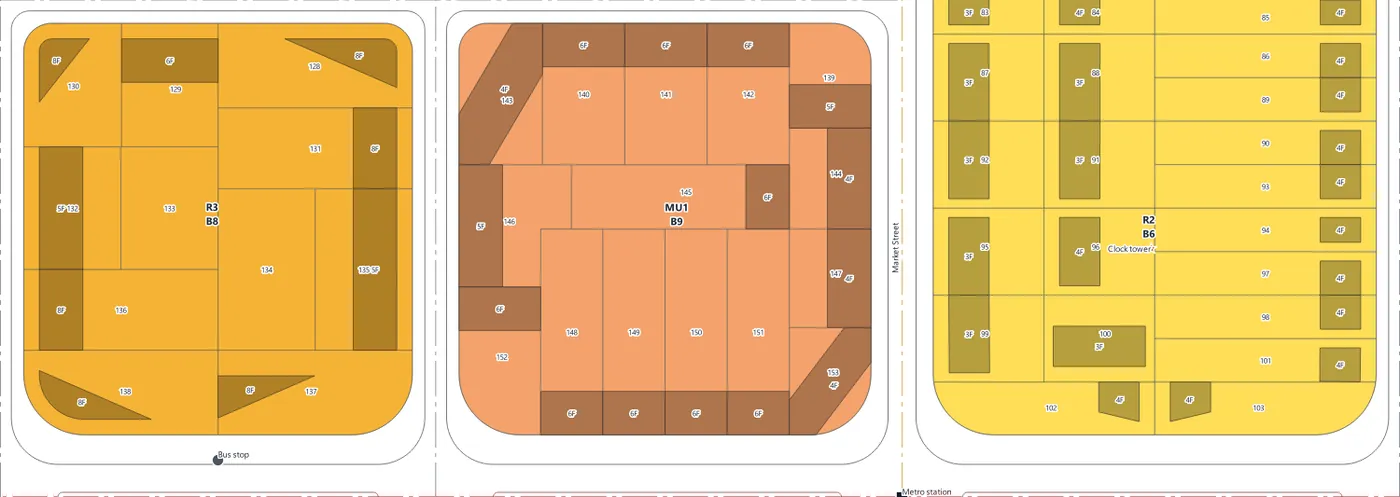
Two options and a comparison sit above the button:
- Tower podium: Mixed use & commercial (default), Every tower or No podiums. A podium is two storeys along the street with the tower set back 3 m above it.
- Chamfer block corners (on by default): perimeter blocks and corner rows turn the rounded street corner into a short straight facade; off, the building follows the curve of the kerb.
- Compare typologies: select one numbered block on the zoning layer; every typology is tried on its parcels without writing anything, and a table compares floor area, coverage, storeys and homes. ★ marks the form with the most floor area that still builds on nine lots in ten. Apply to block stores the chosen typology as the block's override and rebuilds its buildings.
7+ · Site plan
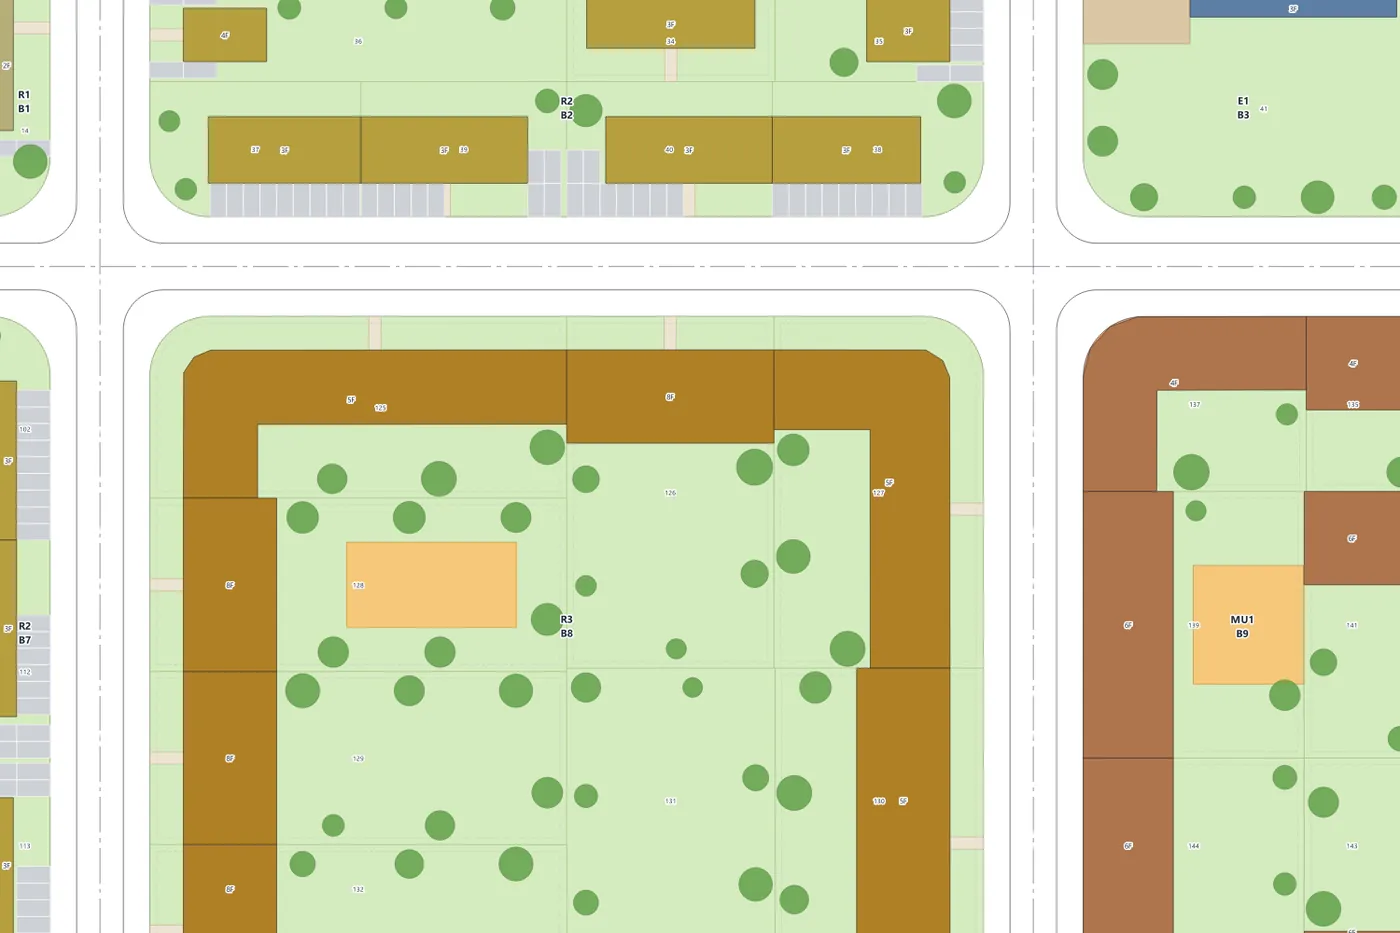
Lays out every built lot (or the selected parcels or blocks): parking by the zoning-code rule (spaces per 100 m² of floor area), paths and plazas, gardens, trees and play areas, written to plan_site. Parking is Surface, then underground (surface bays first, a basement for what does not fit), Surface only (the rest is reported as a shortfall) or All underground. Tiles show the parking provided, the shortfall, trees and play areas. Generate the buildings first; re-subdividing a block removes its buildings and site elements, since they stood on the old lots.
8 · Balance
Live plan figures (population, dwellings, jobs, blocks without a use) and a bar of the land shares by colour family. Open the balance switches to the Balance page.
Under the quick balance a note compares the plan capacity with the target population and shows the share of residents within walking distance of every amenity, once a projection or an accessibility run exists (section 15).
Saving and live rebuild
The live rebuild watches the network layer. When a road, the boundary or a division line is added, moved, deleted or changed, the streets, kerbs and blocks are rebuilt after a short pause (about a third of a second), so a quick series of edits triggers one rebuild. Blocks keep their identity: each new block takes the attributes of the old block it overlaps most; when one block becomes two, both halves keep the land use and the larger half keeps the number.
The Zoning Code
The Zoning Code window (Code page, or Plugins → 02UrbanPlanning → Zoning Code…) holds every rule the plan uses. Values are stored in the plan GeoPackage (plan_zoning_code) and drive the parcels, the buildings and the plan balance. Press Save to write them; the zoning and building styles are refreshed. Regenerate the buildings to apply new rules to them.
Tabs
| Tab | Contents |
|---|---|
| Land uses & rules | One row per land use with its colour swatch (click to change), code, name and every rule below. A filter box, Reset selected, Reset all (back to the catalogue defaults), Export JSON… and Import JSON… (zoning code and amenity standards in one file, to reuse a code across plans). |
| Amenity standards | Land per 1,000 residents, walking distance and the land-use codes that supply each amenity (section 12). |
| Plan settings | Plan name, plan horizon year, planning authority, prepared by, target population, household size (persons per dwelling, default 2.8), average dwelling size (m² gross, default 90), and the switches Clip streets at the plan boundary, Draw kerb lines and Rebuild while editing roads. |
| Road classes | The default cross-sections by functional class (read-only reference; each road keeps its own widths). |
| Reference | The colour convention, the UN-Habitat targets and how rules combine. |
Every rule explained
| Rule | Unit | Meaning and how the plugin uses it |
|---|---|---|
| FAR | ratio | Floor area ratio: gross floor area ÷ lot area. The building step gives a footprint floor(FAR × lot area ÷ footprint) storeys, never more than the storey limit. Before buildings exist, a block's floor-area capacity is FAR × block area. |
| Site coverage | % of lot | Maximum share of the lot covered by buildings. The footprint is trimmed to coverage × lot area, and never above FAR × lot area so that one storey still fits the FAR (when coverage is 0, 60 % of the lot is the working limit). |
| Max storeys | storeys | Maximum number of storeys above ground; 0 means no storey cap. |
| Max height | m | Maximum building height; converted to storeys as floor(max height ÷ storey height). The tighter of the storey cap and the height cap applies; with neither, the building step uses 30 storeys as its ceiling. |
| Density | du/ha | Maximum dwelling units per net hectare. Dwellings on a lot are capped at density × lot area ÷ 10,000 (for a block without buildings, on the block area). |
| Min lot | m² | Minimum lot area for subdivision. Lots smaller than the merge threshold are merged into a neighbour; lots larger than four times the minimum are split again. |
| Min frontage | m | Minimum street frontage of a lot (passed to the engine as at most 80 % of the lot width). |
| Lot width | m | Typical lot width: the spacing of the division lines when blocks are subdivided. A use is subdivided only when Parcels is on and the lot width is above 0. |
| Lot depth | m | Typical lot depth; 0 lets the block decide (single or double row of lots by block width). |
| Front, Side, Rear | m | Setbacks from the street line, the side boundaries and the rear boundary. Lot edges on a street are fronts (an interior lot's front is its edge nearest a street); edges roughly parallel to the main front (within 30°) and in the far part of the lot are rears; the rest are sides. Shared walls of attached, perimeter and semi-detached types get no side setback. |
| Open space | % of lot | Minimum landscaped share of the lot, kept in the code as the plan rule for each use (exported with the code). In this version the building step shapes footprints by coverage and setbacks. |
| Typology | choice | Building form used when buildings are generated: no buildings, detached, semi-detached, attached / row, perimeter block, tower in landscape, slab / large footprint, pavilion (section 11). |
| Residential | % of floor area | Share of floor area used as dwellings; the rest is economic floor space that carries jobs. |
| Storey height | m | Floor-to-floor height (default 3.2 m): building height = storeys × storey height; also used for the height cap. |
| Parking | spaces / 100 m² | Parking spaces required per 100 m² of floor area, kept in the code as the plan's parking standard. |
| m²/job | m² | Floor area per job: jobs = floor area × (1 − residential share) ÷ m² per job. 0 means the use carries no jobs. |
| Parcels | switch | Generate parcels in blocks of this use. Uses that build but are not subdivided (schools, hospitals, sports) become one lot per block. |
| Buildings | switch | Generate buildings on lots of this use. |
Block overrides
Six rules can be typed on a block in plan_zoning: far, coverage, max_storeys, max_height, density and typology. A value typed on a block overrides the code for that block only; an empty field uses the code. Overrides are cleared when the block gets another land use.
storey limit = min(max storeys, floor(max height ÷ storey height)) (caps of 0 are ignored)
floor area = footprint × storeys
dwellings = floor(min(floor area × residential share ÷ dwelling size, density × lot area ÷ 10,000))
residents = dwellings × household size · jobs = floor area × (1 − residential share) ÷ m² per job
The Code page also offers presets (Generic, Low-rise suburban, Compact city), JSON import and export, and a legend preview (section 14).
Land-use catalogue: 37 codes in LBCS colour families
Colours follow the convention planners read worldwide, the colour families of the APA Land-Based Classification Standards (LBCS): residential in yellows to browns by density, mixed use in orange, commercial in reds, industrial in purples, public and institutional uses in blues, parks and open space in greens, transport and utilities in greys, rural and natural land in pale olive. Within each family the tones are tuned so neighbouring classes stay distinguishable on screen and in print. Every colour can be changed in the Zoning Code; hatched codes carry a pattern over the fill.
| Code | Land use | Description | Amenity group | |
|---|---|---|---|---|
| Residential | ||||
R1 | Low-density residential | Detached houses on individual lots. | – | |
R2 | Medium-density residential | Semi-detached and small apartment buildings. | – | |
R3 | High-density residential | Apartment buildings and perimeter blocks. | – | |
R4 | Very high-density residential | Residential towers in landscaped grounds. | – | |
R5 | Rural residential | Large-lot housing at the urban edge. | – | |
| Mixed use | ||||
MU1 | Mixed use (residential over retail) | Ground-floor shops and services with homes above. | – | |
MU2 | Mixed use (urban centre) | Dense centre with offices, retail and housing. | – | |
| Commercial | ||||
C1 | Neighbourhood commercial | Local shops and services within walking distance. | – | |
C2 | General commercial | Retail, services and hospitality. | – | |
C3 | Central business district | Offices and high-order services. | – | |
C4 | Office & business park | Campus-style offices and research. | – | |
| Industrial | ||||
I1 | Light industrial | Workshops, light manufacturing, makerspaces. | – | |
I2 | General industrial | Manufacturing and processing. | – | |
I3 | Logistics & warehousing | Distribution centres and storage. | – | |
| Public & institutional | ||||
E1 | Pre-school & primary school | Kindergartens and primary schools. | Pre-school & primary | |
E2 | Secondary school | Middle and high schools. | Secondary school | |
E3 | Higher education & research | Universities, colleges and institutes. | – | |
H1 | Health care | Clinics, health centres and hospitals. | Health care | |
G1 | Civic & government | Town hall, courts and public administration. | Civic & government | |
K1 | Community & cultural | Community centres, libraries, museums, theatres. | Community & cultural | |
K2 | Places of worship | Religious buildings of every faith. | Places of worship | |
S1 | Public safety & emergency | Fire, police and emergency services. | Public safety | |
| Parks & open space | ||||
P1 | Park & public garden | Neighbourhood and district parks. | Parks & gardens | |
P2 | Playground & pocket park | Children's play and small green spaces. | Equipped play | |
P3 | Sports & recreation | Playing fields, sports halls, pools. | Outdoor sports | |
P4 | Plaza & civic square | Hard-landscaped public squares. | – | |
P5 | Green buffer & corridor | Landscape buffers, green corridors and riparian strips. | – | |
P6 | Cemetery | Burial grounds. | – | |
| Transport & utilities | ||||
T1 | Street right-of-way | Streets generated from the road network. | – | |
T2 | Highway & expressway | Access-controlled roads generated from the road network. | – | |
T3 | Transit & rail | Stations, depots and rail corridors. | – | |
T4 | Public parking | Surface and structured public parking. | – | |
U1 | Utilities & infrastructure | Water, energy, waste and telecom facilities. | – | |
| Rural & natural | ||||
A1 | Agriculture | Farmland and orchards. | – | |
N1 | Natural & conservation area | Forests, wetlands and protected habitats. | – | |
W1 | Water body | Rivers, lakes and the sea. | – | |
X1 | Future development reserve | Land held for a later plan phase. | – | |
Zoning-code defaults
The working defaults every new plan starts from. Replace them with your local regulation in the Zoning Code.
| Code | FAR | Cover | Storeys | Height m | du/ha | Lot w m | Min lot m² | Front. m | F / S / R m | Open | Typology | Res. | Park. | m²/job | Parcels | Bldgs |
|---|---|---|---|---|---|---|---|---|---|---|---|---|---|---|---|---|
R1 | 0.5 | 35% | 2 | 9 | 20 | 18 | 450 | 15 | 5 / 3 / 5 | 40% | Detached | 100% | 1.5 | – | ✓ | ✓ |
R2 | 1.2 | 40% | 4 | 15 | 60 | 14 | 300 | 12 | 5 / 3 / 4 | 30% | Semi-detached | 100% | 1.2 | – | ✓ | ✓ |
R3 | 2.4 | 45% | 8 | 28 | 150 | 26 | 600 | 20 | 5 / 4 / 6 | 25% | Perimeter block | 100% | 1 | – | ✓ | ✓ |
R4 | 4 | 35% | 20 | 65 | 300 | 40 | 1500 | 30 | 8 / 8 / 8 | 35% | Tower in landscape | 100% | 0.8 | – | ✓ | ✓ |
R5 | 0.15 | 15% | 2 | 8 | 5 | 40 | 2000 | 30 | 10 / 6 / 10 | 70% | Detached | 100% | 2 | – | ✓ | ✓ |
MU1 | 2.5 | 60% | 6 | 22 | 120 | 20 | 400 | 16 | 0 / 0 / 5 | 15% | Attached | 70% | 1 | 40 | ✓ | ✓ |
MU2 | 3.5 | 65% | 10 | 36 | 180 | 30 | 800 | 24 | 0 / 0 / 6 | 15% | Perimeter block | 50% | 0.8 | 25 | ✓ | ✓ |
C1 | 1 | 50% | 3 | 12 | – | 20 | 400 | 16 | 3 / 0 / 5 | 15% | Attached | – | 2.5 | 40 | ✓ | ✓ |
C2 | 2 | 55% | 6 | 24 | – | 30 | 800 | 24 | 5 / 3 / 5 | 15% | Slab | – | 3 | 35 | ✓ | ✓ |
C3 | 6 | 70% | 30 | 110 | – | 36 | 1200 | 30 | 0 / 0 / 6 | 10% | Tower in landscape | – | 1 | 18 | ✓ | ✓ |
C4 | 1.5 | 40% | 6 | 24 | – | 45 | 2000 | 36 | 8 / 6 / 8 | 30% | Slab | – | 2.5 | 20 | ✓ | ✓ |
I1 | 1 | 55% | 3 | 15 | – | 40 | 1500 | 30 | 8 / 5 / 6 | 15% | Slab | – | 1 | 60 | ✓ | ✓ |
I2 | 0.8 | 60% | 2 | 18 | – | 60 | 4000 | 50 | 10 / 8 / 8 | 10% | Slab | – | 0.6 | 90 | ✓ | ✓ |
I3 | 0.7 | 60% | 1 | 16 | – | 80 | 6000 | 60 | 12 / 10 / 10 | 10% | Slab | – | 0.4 | 120 | ✓ | ✓ |
E1 | 0.8 | 30% | 3 | 13 | – | – | – | – | 8 / 8 / 8 | 40% | Pavilion | – | 0.8 | 60 | – | ✓ |
E2 | 0.8 | 30% | 4 | 16 | – | – | – | – | 10 / 10 / 10 | 40% | Pavilion | – | 0.8 | 60 | – | ✓ |
E3 | 1.2 | 30% | 6 | 24 | – | – | – | – | 10 / 10 / 10 | 40% | Pavilion | – | 1 | 40 | – | ✓ |
H1 | 1.5 | 40% | 6 | 26 | – | – | – | – | 8 / 8 / 8 | 30% | Pavilion | – | 1.5 | 45 | – | ✓ |
G1 | 1.5 | 40% | 5 | 20 | – | – | – | – | 8 / 6 / 6 | 30% | Pavilion | – | 2 | 30 | – | ✓ |
K1 | 1 | 40% | 3 | 15 | – | – | – | – | 6 / 5 / 5 | 30% | Pavilion | – | 1.5 | 80 | – | ✓ |
K2 | 0.8 | 40% | 2 | 18 | – | – | – | – | 6 / 5 / 5 | 30% | Pavilion | – | 1 | – | – | ✓ |
S1 | 0.8 | 40% | 3 | 14 | – | – | – | – | 8 / 5 / 5 | 20% | Pavilion | – | 1 | 50 | – | ✓ |
P1 | – | – | – | – | – | – | – | – | – | 95% | – | – | – | – | – | – |
P2 | – | – | – | – | – | – | – | – | – | 95% | – | – | – | – | – | – |
P3 | 0.2 | 15% | 2 | 14 | – | – | – | – | 6 / 6 / 6 | 80% | Pavilion | – | – | – | – | ✓ |
P4 | – | – | – | – | – | – | – | – | – | – | – | – | – | – | – | – |
P5 | – | – | – | – | – | – | – | – | – | 100% | – | – | – | – | – | – |
P6 | – | – | – | – | – | – | – | – | – | 80% | – | – | – | – | – | – |
T1 | – | – | – | – | – | – | – | – | – | – | – | – | – | – | – | – |
T2 | – | – | – | – | – | – | – | – | – | – | – | – | – | – | – | – |
T3 | 0.5 | 30% | 2 | 15 | – | – | – | – | – | – | Slab | – | – | 80 | – | ✓ |
T4 | – | – | – | – | – | – | – | – | – | – | – | – | – | – | – | – |
U1 | 0.3 | 30% | 2 | 10 | – | – | – | – | – | – | Slab | – | – | 200 | – | ✓ |
A1 | – | – | – | – | – | – | – | – | – | – | – | – | – | – | – | – |
N1 | – | – | – | – | – | – | – | – | – | 100% | – | – | – | – | – | – |
W1 | – | – | – | – | – | – | – | – | – | – | – | – | – | – | – | – |
X1 | – | – | – | – | – | – | – | – | – | – | – | – | – | – | – | – |
Road classes and the network engine
Eight functional classes. A new road takes its class's cross-section; each road keeps its own widths in plan_network, so a section can be changed road by road. Streets are generated into plan_zoning as land use T1 (street right-of-way), expressways as T2 and greenways as P5.
| Class | Name | ROW m | Carriageway m | Median m | Sidewalk m | Cycle track m | Kerb radius m | km/h | Lanes | Land use | |
|---|---|---|---|---|---|---|---|---|---|---|---|
FWY | Expressway | 60 | 22 | 4 | – | – | – | 100 | 6 | T2 Highway & expressway | |
ART | Arterial | 40 | 21 | 3 | 4.5 | 2 | 15 | 60 | 6 | T1 Street right-of-way | |
SAR | Minor arterial | 30 | 14 | 2 | 4 | 1.5 | 12 | 50 | 4 | T1 Street right-of-way | |
COL | Collector | 20 | 9 | – | 3.5 | 1.5 | 9 | 50 | 2 | T1 Street right-of-way | |
LOC | Local street | 15 | 7 | – | 3 | – | 6 | 30 | 2 | T1 Street right-of-way | |
ACC | Access lane | 10 | 5.5 | – | 2.25 | – | 4 | 20 | 1 | T1 Street right-of-way | |
PED | Pedestrian street | 10 | 0 | – | 5 | – | 3 | 5 | – | T1 Street right-of-way | |
GRN | Greenway & cycle path | 6 | 0 | – | 3 | – | 2 | 20 | – | P5 Green buffer & corridor |
How streets, kerbs and blocks are built
- Junctions. Points where two or more centrelines meet (shared ends, T-ends and crossings, within 5 cm) are junctions.
- Right-of-way. Each centreline is buffered by half its right-of-way with flat ends. Where a centreline ends on another road its end gets a disc of the same half width, so L-corners and T-junctions close cleanly; dead ends stay square.
- Junction corners. At every junction the right-of-way is closed locally with a radius equal to the largest kerb radius plus sidewalk of the roads that meet, which fills the re-entrant corners with true circular arcs. Only fillet-sized pieces near the junction are kept, so narrow blocks elsewhere are never swallowed.
- Streets by class. The right-of-way is split by class, higher classes first, so the junction square belongs to the major road.
- Kerbs. The same is done for the carriageway with the kerb radius. Medians are cut out and opened at every junction where another road joins, with rounded noses; a plain continuation of the same road keeps its median.
- Blocks. Plan area minus right-of-way (or, without a boundary, every area the streets enclose), split by division lines. Leftovers smaller than 25 m² or thinner than about 1 m are slivers, not blocks.
Junction solutions
A solution is a point in plan_junctions (solution, params as JSON, name, notes) applied on top of the steps above on every rebuild. Its islands are written to plan_zoning as street land with the class ISL and the land use P5, so the balance counts them as green buffer, and blocks + streets + islands still add up to the plan area. All dimensions are editable per junction; the defaults are working values to check against your local design standard.
| Solution | What is built | Defaults |
|---|---|---|
| Roundabout | Central island, circulatory carriageway with its outer kerb, a splitter island on every arm joined to the median, entry and exit curves of the entry radius, arms widened beside the splitters. Refused on fewer than three arms or when the next junction is too close; splitters and tapers are trimmed to the room available. | Single-lane: inscribed diameter 36 m, ring 6 m, entry radius 15 m, splitter 15 × 3 m. Two-lane: 50 m, 9.5 m, 20 m, 20 × 4 m. Inside the ranges of FHWA (2000) and NCHRP Report 672 (2010). |
| Channelized junction | A teardrop island on every minor approach, a lane kept on each side; the minor kerb eases back to its normal line without a kink. | Nose 3 m behind the major carriageway, radius 1.5 m, length 25 m, lane 3.5 m, taper 15 m. |
| Grade-separated crossing | No at-grade connection: no corner fills, the upper road's kerbs and median run straight through and the lower carriageway stops at the deck edge. Upper road: Major road over (the higher class, default) or Minor road over. | No dimensions of its own. |
| Right-in / right-out | The major road's median stays closed across the junction; where it has none, a divider is added. | Divider 2 m wide, running 15 m past the minor road on each side. |
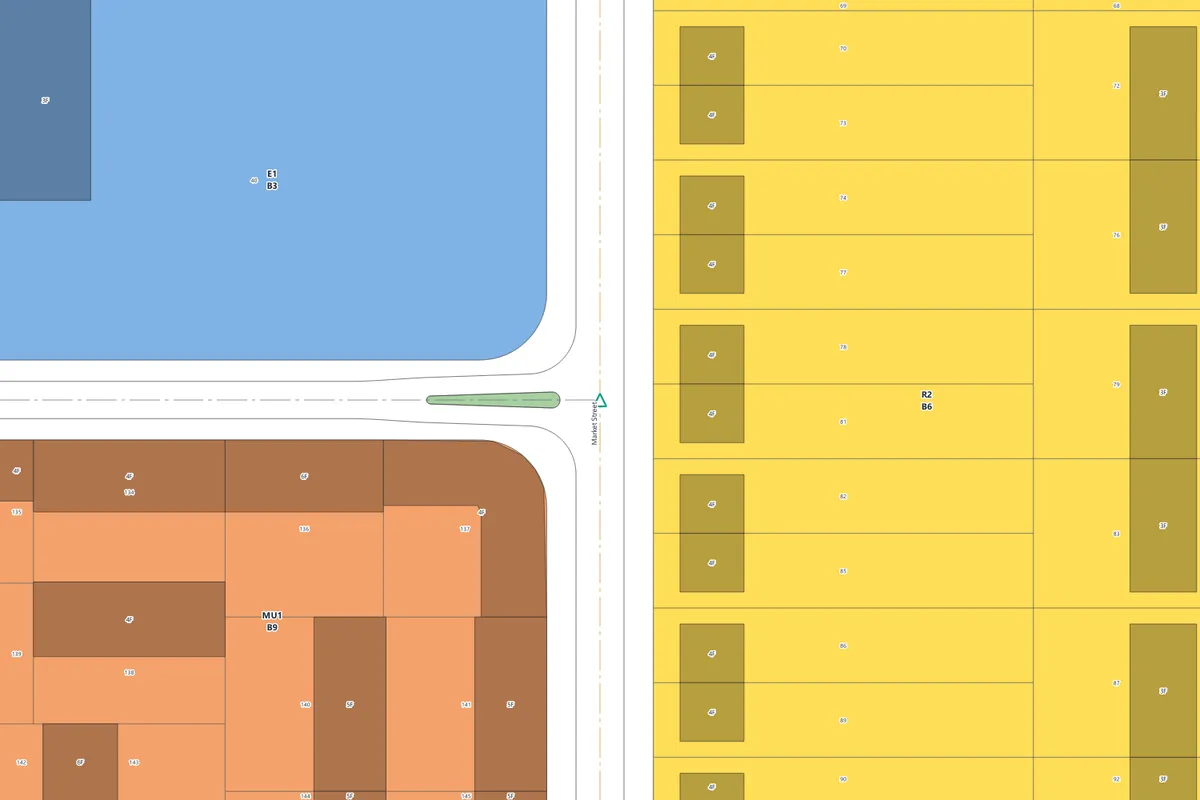
Junction spacing. After every rebuild, at-grade junctions closer than a minimum along their class are reported: expressway 1,000 m, arterial 200 m, minor arterial 120 m (working defaults in the order of unsignalised access spacing in access-management practice, e.g. the TRB Access Management Manual, 2014). Override them per plan with the setting junction_spacing_<CLASS>. At-grade junctions on an expressway are flagged too.
Local rebuild
The live rebuild remembers the previous result and rebuilds only a window around what changed: streets, islands and kerbs are patched inside it and every block touching it is rebuilt whole, with its land use and number. The result is the same as a full rebuild (a stress test checks this after every one of dozens of random edits). A full rebuild is used for the first rebuild, after an option change, for boundary and division-line edits, for changes reaching more than half the plan, and for plans with fewer than 40 roads. A full rebuild of a big plan shows a progress window with Cancel, which leaves the plan as it was.
Blocks removed by an edit are remembered in the plan: when an undo or a redrawn road brings a block back in the same shape, it gets its old land use, overrides and number again.
Overlays and point types
Overlays (10)
| Code | Overlay | |
|---|---|---|
OV-HER | Heritage conservation area | |
OV-FLD | Flood hazard zone | |
OV-GEO | Geological hazard zone | |
OV-ECO | Ecological protection zone | |
OV-TOD | Transit-oriented development area | |
OV-REN | Urban regeneration area | |
OV-SPA | Special planning area | |
OV-PH1 | Phase 1 development | |
OV-PH2 | Phase 2 development | |
OV-AIR | Airport safeguarding zone |
Point types (21)
Point types marked with an amenity group belong to that provision family; the Balance page measures provision by zoned land.
| Code | Point | Group | Marker | Amenity group | |
|---|---|---|---|---|---|
PT-KG | Kindergarten | Education | circle | Pre-school & primary | |
PT-PS | Primary school | Education | circle | Pre-school & primary | |
PT-SS | Secondary school | Education | circle | Secondary school | |
PT-HC | Health centre | Health | cross | Health care | |
PT-HO | Hospital | Health | cross | Health care | |
PT-CC | Community centre | Community | square | Community & cultural | |
PT-LB | Library | Community | square | Community & cultural | |
PT-WS | Place of worship | Community | pentagon | Places of worship | |
PT-FS | Fire station | Safety | triangle | Public safety | |
PT-PL | Police station | Safety | triangle | Public safety | |
PT-MK | Market | Commerce | diamond | – | |
PT-BS | Bus stop | Transit | circle | – | |
PT-MS | Metro / rail station | Transit | square | – | |
PT-BK | Bike share dock | Transit | circle | – | |
PT-PK | Parking entrance | Transit | square | – | |
PT-PG | Playground | Open space | star | Equipped play | |
PT-SP | Sports facility | Open space | hexagon | Outdoor sports | |
PT-LM | Landmark | Identity | star | – | |
PT-VW | Protected view point | Identity | arrowhead | – | |
PT-TR | Tree to keep | Landscape | circle | – | |
PT-UT | Utility node | Utilities | square | – |
Network line kinds
plan_network stores one kind per line: road (road centreline), boundary (plan boundary), division (land-use division line), overlay (overlay boundary), rail (railway), waterway (waterway), utility (utility line), kerb (kerb line (generated)). Road centrelines, the boundary and division lines drive the rebuild; railways, waterways and utility lines are drawn and styled but do not cut blocks.
Parcels: the ParcelFlux engine
Subdivision uses a bundled copy of the ParcelFlux engine (ParcelFlux plugin v0.3.8, same author, GPL-3.0-or-later), so no other plugin is needed. Blocks are grouped by the lot rules of their use (lot width, minimum lot area, lot depth, minimum frontage) and each group is subdivided in one run.
- Each block is read as regular (four corners) or irregular; an irregular block keeps its real shape and its oriented bounding box guides the line direction.
- The two shortest edges are the block's ends; division lines run perpendicular to them.
- A block wider than 1.8 lot widths gets a double row of lots (back to back), a narrower one a single row.
- Division lines are placed at the lot width, varied by the Width variation slider with a seeded generator, so the same seed gives the same parcels.
- Lines are clipped to the block and split it; fragments smaller than 35 m² are merged into the neighbour with the longest shared edge (three passes); lots larger than four times the minimum lot are split again.
Blocks of uses that build but are not subdivided (education, health care, civic, community, worship, public safety, sports, transit and utilities) become one lot each, flagged whole block, so the building step can place their buildings. Parks, plazas, streets and water get no parcels. Generating parcels for a set of blocks replaces only the parcels of those blocks; parcels are numbered block by block, north to south and west to east, and every lot records its street frontage.
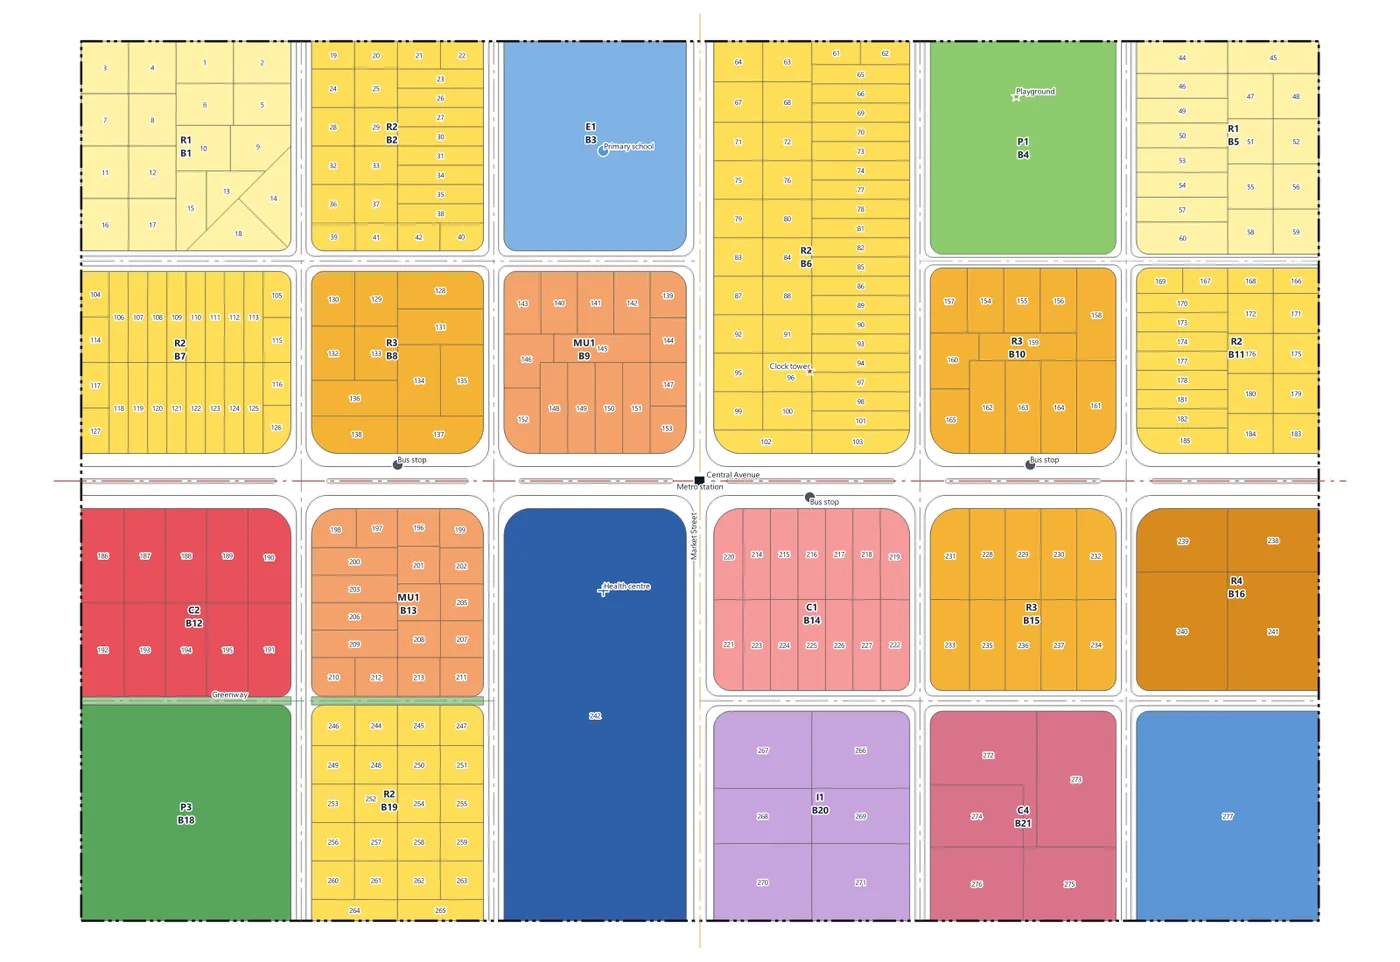
Buildings: typologies and how the caps combine
For every lot the engine classifies the edges (front, side, rear; side edges shared with the next lot are party walls for attached, semi-detached and perimeter types), cuts the setbacks off edge by edge (party walls get none), and shapes the footprint by typology, always oriented to the street. The footprint is trimmed to the tighter of the site-coverage limit and the FAR (a one-storey building never exceeds the FAR); footprints below the typology's minimum width or depth, or under 25 m², are rejected. Storeys come from the FAR, the storey cap and the height cap, whichever is tightest, and floor area, dwellings (capped by density), residents and jobs are written on the building. Regenerating replaces the buildings of the processed parcels.
| Typology | Footprint | Min width m | Depth m (min–max) | Default uses |
|---|---|---|---|---|
| Detached (free-standing) | The largest rectangle in the frame of the main front that fits the buildable area, free-standing within all four setbacks. | 6 | 6–14 | R1, R5 |
| Semi-detached (pairs) | A rectangle; each lot pairs with one side neighbour along the street, and the two halves share the party wall, the build line and the depth. | 5 | 6–13 | R2 |
| Attached / row (terrace) | A rectangle running the full lot width, so the row reads as one street wall with one rear line; corner lots take a band that follows the street round the corner. | 4.5 | 7–14 | MU1, C1 |
| Perimeter block (courtyard) | A band along the street that follows it round the corner, with a mitred inner face and a chamfered outer corner, leaving the block interior as a courtyard. | 6 | 8–14 | R3, MU2 |
| Tower in landscape | A compact rectangle in its grounds (footprint at most 900 m²); with the podium option, a two-storey podium along the street and the tower set back 3 m above it. By default (auto) mixed and commercial towers get a podium: homes go to the tower, other floor space to the podium. | 12 | 12–30 | R4, C3 |
| Slab / large footprint | A large rectangle in the frame of the front; on deep lots a second parallel slab (at least 12 m apart) when coverage allows. Single-storey sheds may be up to 60 m deep. | 8 | 8–24 | C2, C4, I1, I2, I3, T3, U1 |
| Pavilion (public building) | A compact public building that keeps an 8 m forecourt in front when the lot allows. | 10 | 10–32 | E1, E2, E3, H1, G1, K1, K2, S1, P3 |
Reading a building
Buildings are drawn in a darker tone of their land-use colour and labelled with their storeys (4F = four floors) at large scales. Each building carries storeys, height, footprint, gfa, dwellings, population (dwellings × household size) and jobs; the plan balance reads these numbers wherever a block has buildings.
How a footprint is placed
- Facing the street. Each lot gets a local frame on its main front, and the footprint is the largest rectangle in that frame that fits the buildable area within the typology's width and depth limits. A lot with no street frontage faces its open block edge.
- The tighter cap wins. The footprint target is the smaller of coverage and FAR ÷ storeys, so a one-storey building never exceeds the FAR; storey, height and density caps apply on top. Lots below the minimum width or depth of the typology are skipped and reported with the reason.
- Pairs and rows. Semi-detached houses pair only with a side neighbour on the same street line; in an odd row one lot stays detached. Attached rows share one rear line, and perimeter blocks close into continuous courtyard rings.
Site plan
| Element | How it is laid out |
|---|---|
| Parking | Surface bays in single- or double-loaded rows whose aisles start at the street (every aisle is checked to reach it); houses get driveway bays up to two deep; the rest goes to a basement with levels and a ramp, or is reported as a shortfall. |
| Paths and plazas | Footpaths to the front doors of homes, forecourts for shops and mixed uses, plazas in front of public buildings. |
| Gardens and trees | The open rest of the lot is garden; trees of varied size line the street frontage and the lot lines, a few stand in large gardens and groves in parks, clear of the buildings and the paving. |
| Play areas | One per block with 20 homes or more: 1.5 m² per home, 100–600 m². |
Balance and indicators
The balance is meaningful from the first block onwards: a block with buildings counts its buildings; any other block counts its zoning-code capacity (FAR × area for floor area, the residential share and dwelling size for dwellings, capped by density). The Balance page reports how many blocks are counted from buildings.
Key figures
| Figure | Definition |
|---|---|
| Plan area (ha) | Area inside the plan boundary; without a boundary, the zoned area (blocks plus streets). |
| Population, dwellings, jobs | Summed over blocks, from buildings or from capacity. |
| Floor area (m²) | Gross floor area of all blocks. |
| Gross FAR | Floor area ÷ plan area. |
| People / ha | Population ÷ plan area in hectares (gross density). |
| Dwellings / ha net | Dwellings ÷ area of blocks whose use has a residential share (net residential density). |
| Target population | When a target is set in the plan settings, the page says how many more people the plan houses, or by how many it falls short. |
The land budget lists every land use (and streets) with its area in hectares and its share of the plan area, with a bar of shares by colour family; blocks without a use are shown separately.
UN-Habitat neighbourhood targets
The plan is measured against UN-Habitat (2014), A New Strategy of Sustainable Neighbourhood Planning: Five Principles. Each target is a meter on the Balance page and a row in the report.
| Principle | Target | Plan indicator |
|---|---|---|
| Adequate space for streets | At least 30 % of land in streets | Area of T1 and T2 streets ÷ plan area |
| Efficient street network | At least 18 km of street per km² | Centreline length inside the plan ÷ plan area |
| High density | At least 15,000 people per km² | Population ÷ plan area |
| Mixed land use | At least 40 % of floor area in economic use | Non-residential floor area ÷ total floor area |
The other two principles of the strategy, social mix (a share of affordable housing) and limited land-use specialisation (fewer than 10 % of blocks in a single use), concern housing tenure and the mix inside blocks; they are named in the Reference tab of the Zoning Code and are left to the planner's judgement.
Amenity provision
For each amenity the balance compares the land zoned for it (the area of blocks with the listed land-use codes) with the need of the planned population (hectares per 1,000 residents × population ÷ 1,000), and reports the provision ratio and the zoned area per person. A ratio of 100 % or more meets the standard.
| Amenity | ha per 1,000 | Walk m | Land uses | Source of the default |
|---|---|---|---|---|
| Pre-school & primary | 0.60 | 800 | E1 | Editable working default |
| Secondary school | 0.50 | 1,500 | E2 | Editable working default |
| Health care | 0.25 | 1,200 | H1 | Editable working default |
| Community & cultural | 0.20 | 1,000 | K1 | Editable working default |
| Places of worship | 0.10 | 1,000 | K2 | Editable working default |
| Public safety | 0.05 | 3,000 | S1 | Editable working default |
| Civic & government | 0.10 | 3,000 | G1 | Editable working default |
| Parks & gardens | 0.80 | 710 | P1 | Fields in Trust (2015) |
| Equipped play | 0.25 | 400 | P2 | Fields in Trust (2015) |
| Outdoor sports | 1.60 | 1,200 | P3 | Fields in Trust (2015) |
Parks and gardens, equipped play and outdoor sports follow Fields in Trust (2015), Guidance for Outdoor Sport and Play: Beyond the Six Acre Standard. The other standards are editable working defaults for a first plan, typical planning norms rather than a single published source; every jurisdiction sets its own, so replace them in the Amenity standards tab.
The Balance page also holds walking accessibility with the 2SFCA provision index, the population projection, the balance per planning unit and the Excel / CSV export (section 15).
Outputs
Plan sheet (print layout and PDF)
Choose the paper (A0, A1, A2, A3 or A4, landscape) and a title, then Create layout (opens the Layout Designer) or Export PDF… (300 dpi). The sheet has a framed map at a rounded scale (1:500 to 1:100,000) fitted to the plan, the title and a subtitle with the planning authority and horizon year, a legend filtered to the classes drawn on the map, the land-budget table (up to 22 rows) with plan area, population, dwellings, jobs and gross FAR, a north arrow, a scale bar and a title block with scale, CRS, date and author. A layout of the same name is replaced, so the sheet can be regenerated after every change and refined in the Layout Designer.
HTML plan report
Write HTML report… saves one self-contained HTML file: key figures (plan area, population, dwellings, jobs, floor area, gross FAR, gross and net densities), the land budget with colour swatches and bars, the UN-Habitat targets with met / not met, and amenity provision (zoned, needed, m² per person, provision %).
Share the plan
Save a copy of the plan… first saves pending edits, then copies the GeoPackage. It carries the layers, the styles and the zoning code, so it opens styled in any QGIS.
On the sheet the legend is set in two columns and measured at its drawn size; when it is too tall its type shrinks before anything is cut. The land budget is a table with colour swatches and a bold total row, and uses that do not fit are merged into one N other uses row. The map frame keeps its shape and is set to a round scale, which the footer prints. Prepared by appears only when an author is set.
Multi-sheet plan sheets at a true scale and the full report with projection, accessibility and charts are described in section 15.
Plan check, revisions, presets and legend
Check the plan (Plan page)
Check the plan lists the problems a reviewer would mark before the plan is shared, as errors, warnings and notes; click an issue to zoom to it and select the features. Window shows the list in a larger window, and Re-check after every rebuild keeps it current while you draw.
| Check | Severity | What it finds |
|---|---|---|
| No plan boundary / Boundary not closed | Error | The plan has no boundary line, or the boundary lines do not close a polygon. |
| Duplicate / Overlapping centrelines | Error | Two centrelines on top of each other, or sharing a stretch. |
| Block without use | Warning | A block with no land use. |
| Sliver block | Warning | A block under 150 m² or thinner than 6 m (2 × area ÷ perimeter). |
| Unsnapped road end | Warning | A road end stopping within 6 m short of another road, or running up to 6 m past a crossing. |
| Very short road | Warning | A road shorter than 12 m. |
| Road / overlay outside the plan | Warning | A centreline wholly outside the plan area; an overlay with more than 2 % outside it. |
| No street frontage | Warning | A block that touches no street (parks, plazas and rural land excepted). |
| Use vs road class | Warning or note | Industry and logistics on local streets only; high-order commercial on local streets only; a school on an expressway, a primary school on an arterial; low-rise housing on an expressway; health, emergency, industrial, commercial, transit or utility uses fronting only pedestrian streets or greenways. |
| Block without number / Unsaved edits | Note | Unnumbered blocks; plan layers with unsaved edits. |
Revisions (Plan page)
Save snapshot writes the zoning and network as they are now (unsaved edits included) to <plan>_snapshot_<date-time>.gpkg next to the plan. Pick a snapshot, or any other 02UrbanPlanning GeoPackage with …, and press Compare with the current plan: blocks are matched by overlap and the comparison reports added and removed blocks, changed land uses, changed rule overrides and area changes. The result is added to the map as a styled layer (green = gained, red = lost) with a table of each land use before, after and the change in hectares.
Presets and exchange (Code page)
Start from a preset or move a code between plans; the current code is first backed up as JSON next to the plan.
- Generic: the catalogue defaults, a balanced code for a first plan anywhere.
- Low-rise suburban: lower FAR and heights, deeper setbacks, more parking and open space, for detached and semi-detached neighbourhoods.
- Compact city: higher FAR and densities, build-to lines, less parking, for walkable perimeter blocks and mixed-use streets.
Import… loads a zoning code (JSON) exported from another plan; Export… writes this plan's zoning code and amenity standards as JSON. Regenerate the buildings after a preset or an import to apply it.
Legend preview (Code page)
The land-use legend as the plan sheet shows it, filtered by text (code, name, typology), by colour family, or to Only uses in the plan.
Accessibility, projection, exports and plan sheets
Walking accessibility and 2SFCA (Balance page)
Analyse walking access measures, for every amenity standard, the network distance from every residential block to the nearest facility, over the plan's road centrelines (expressways excluded), noded at every crossing. It runs offline in a fraction of a second on a neighbourhood plan.
- Facilities are the blocks zoned for the amenity, reached from any frontage (their boundary is sampled every 40 m), and the plan points of a matching type, reached from the nearest street.
- A residential block is reached from its interior point plus the walk to the nearest street, and is served when its network distance to the nearest facility is within the amenity's walk distance.
- Coverage is the share of the planned population living in served blocks.
- The provision index is a two-step floating catchment (2SFCA): each facility's zoned land is divided by the population within its walk distance, every block sums the ratios of the facilities that reach it, and the sum is expressed against the standard (m² per person), so 1.0 means the standard is met.
The walking catchments (the reachable street network buffered by 45 m) and the residential blocks, served and not served, are added to the map; Show styles the blocks by one amenity or by how many amenities are within reach.
Population projection (Balance page)
Grow a base-year population to the plan horizon; the horizon population becomes the target population the balance checks.
geometric P(t) = P0 · (1 + r)t
logistic P(t) = K / (1 + ((K − P0) / P0) · e−r·t) (K = saturation population)
Enter the model, base year, base population, growth rate (% a year), saturation (logistic only) and horizon, or type past census counts (2000: 8200, 2010: 9100, 2020: 10400) and press Fit to set the rate that matches them and take the last count as the base. Project and set the target writes the result.
Per planning unit and exports (Balance page)
With planning units drawn, a table gives the area, people, jobs and people per hectare of every unit. Export the balance writes every table (land budget, capacity, amenity provision, UN-Habitat targets, per unit, accessibility, projection) as one Excel workbook (Excel…, one sheet per table) or one CSV file (CSV…, the tables one after the other).
Plan sheets (Output page)
A grid of sheets at a true scale (1:500, 1:1,000, 1:2,000, 1:5,000 or 1:10,000) on the chosen paper, with an optional overlap in metres. The grid starts at the top-left corner of the plan and sheets that would show nothing are left out. Create sheet layouts makes one print layout per sheet (named, for example, … — Sheet 1 of 4 (1:1,000, A1)): the map at the exact scale, a legend filtered to what the sheet shows, an index map with the land use, the sheet grid and the current sheet highlighted, the sheet number (Sheet 1/4), north arrow, scale bar and title block. One PDF… exports every sheet as a page of one PDF; PDF per sheet… writes one file per sheet.
Full plan report (Output page)
Write the full report… saves the HTML plan report with the population projection and the last walking-access run added, and its charts.
Processing provider
The plugin registers a 02UrbanPlanning provider in the Processing Toolbox, so the plan chain runs in models, batch mode and scripts. Every algorithm takes a Plan GeoPackage; left empty, it uses the plan open in the project.
| Algorithm | What it does |
|---|---|
| Rebuild streets and blocks | Rebuilds right-of-way, junction corners, kerbs and blocks from the centrelines; options: clip to the plan boundary, generate kerb lines, number new blocks. |
| Subdivide blocks into parcels | Subdivides every block by the lot rules of its land use with the bundled ParcelFlux engine; parcels of the processed blocks are replaced. |
| Generate buildings | Places buildings on the parcels under the zoning code. |
| Plan balance | The balance as a table, with optional Excel workbook and HTML report; optionally includes walking accessibility. |
| Accessibility catchments | Walking catchments and the residential blocks with their walk distance (d_<amenity>, m) and 2SFCA provision index (i_<amenity>, 1 = standard met) for one amenity or every amenity; reports the share of the population reaching every amenity. |
FAQ and troubleshooting
“Choose a projected CRS in metres” when I create a plan.
The plan needs a projected CRS in metres (a national grid or a UTM zone). Pick one in the CRS field of the New plan section. The map may stay in any CRS; drawing is transformed to the plan CRS.
My edits are not in the GeoPackage.
Road, boundary, division-line and point edits go into the layer edit buffer so they can be undone. Press Save edits in the panel header (it appears when something is unsaved) or save the layers in QGIS. Generated streets, kerbs, parcels and buildings are written directly.
Blocks do not follow my road edits.
Check Rebuild while editing roads on the Draw page, or press Rebuild now. Roads must actually meet: snap the ends to other roads (the road tool snaps automatically) so a junction exists. A road that stops short leaves a dead end, and the block around it stays whole.
A block lost or kept the wrong land use after a big change.
Each new block inherits from the old block it overlaps most. After a large redesign, check the orange-dashed blocks (no use) and repaint them; Number blocks with Shift renumbers everything if the numbering no longer reads well.
A block has no parcels or buildings.
Its use may have Parcels or Buildings switched off, a lot width of 0 or the typology No buildings (parks, plazas, water). Setbacks larger than the lot leave no buildable area, and footprints under 25 m² are skipped. Generate parcels before buildings.
The balance population differs from the buildings.
Blocks without buildings are counted from their zoning-code capacity. Generate buildings for every block to count only buildings, and press Refresh on the Balance page.
New rules did not change the buildings.
The zoning code is applied when buildings are generated. After saving the code, run Generate buildings again (and Generate parcels when lot rules changed).
3D view does not open.
The 3D map view needs the QGIS 3D module. Buildings carry their 3D extrusion in the layer style; View → 3D Map Views → New 3D Map View shows them in any QGIS with 3D.
Citation and licence
| Name | 02UrbanPlanning - Urban Planning Studio |
| Package | zero2urbanplanning |
| Version | 0.2.0 (experimental) |
| QGIS | 3.28 or newer; QGIS 4 supported |
| Licence | GPL-3.0-or-later; the bundled parcel engine is ParcelFlux by the same author, under the same licence |
| Developer | Geophilo · Yusuf Eminoğlu (ORCID 0009-0005-6000-2934) |
| Contact | [email protected] |
| Source | github.com/YusufEminoglu/zero2urbanplanning |
| Hub | plugins.qgis.org/plugins/zero2urbanplanning |
| Revision | November 2026 |
Cite the software
@software{eminoglu_02urbanplanning_2026,
  author  = {Eminoğlu, Yusuf},
  title   = {02UrbanPlanning: Urban Planning Studio for QGIS},
  version = {0.2.0},
  year    = {2026},
  license = {GPL-3.0-or-later},
  url     = {https://geophilo.com/zero2urbanplanning/}
}
References
- American Planning Association. Land-Based Classification Standards (LBCS), colour coding of land-use families.
- UN-Habitat (2014). A New Strategy of Sustainable Neighbourhood Planning: Five Principles. Nairobi: UN-Habitat.
- Fields in Trust (2015). Guidance for Outdoor Sport and Play: Beyond the Six Acre Standard. London: Fields in Trust.
The plugin is a planning-studio tool: its figures make every plan decision traceable and comparable, and the adopted plan and its regulation remain the reference for the statutory values.