📐
Dynamic Grid Topologies
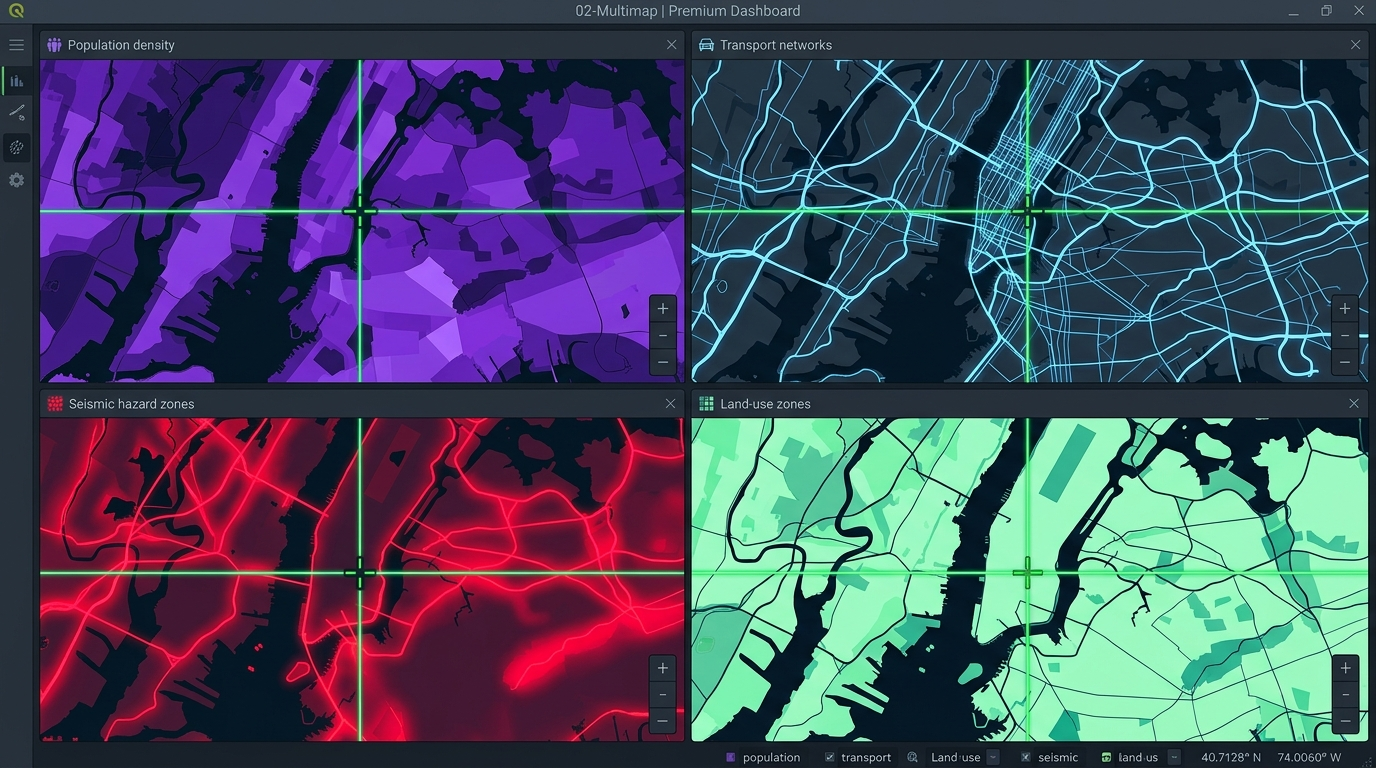
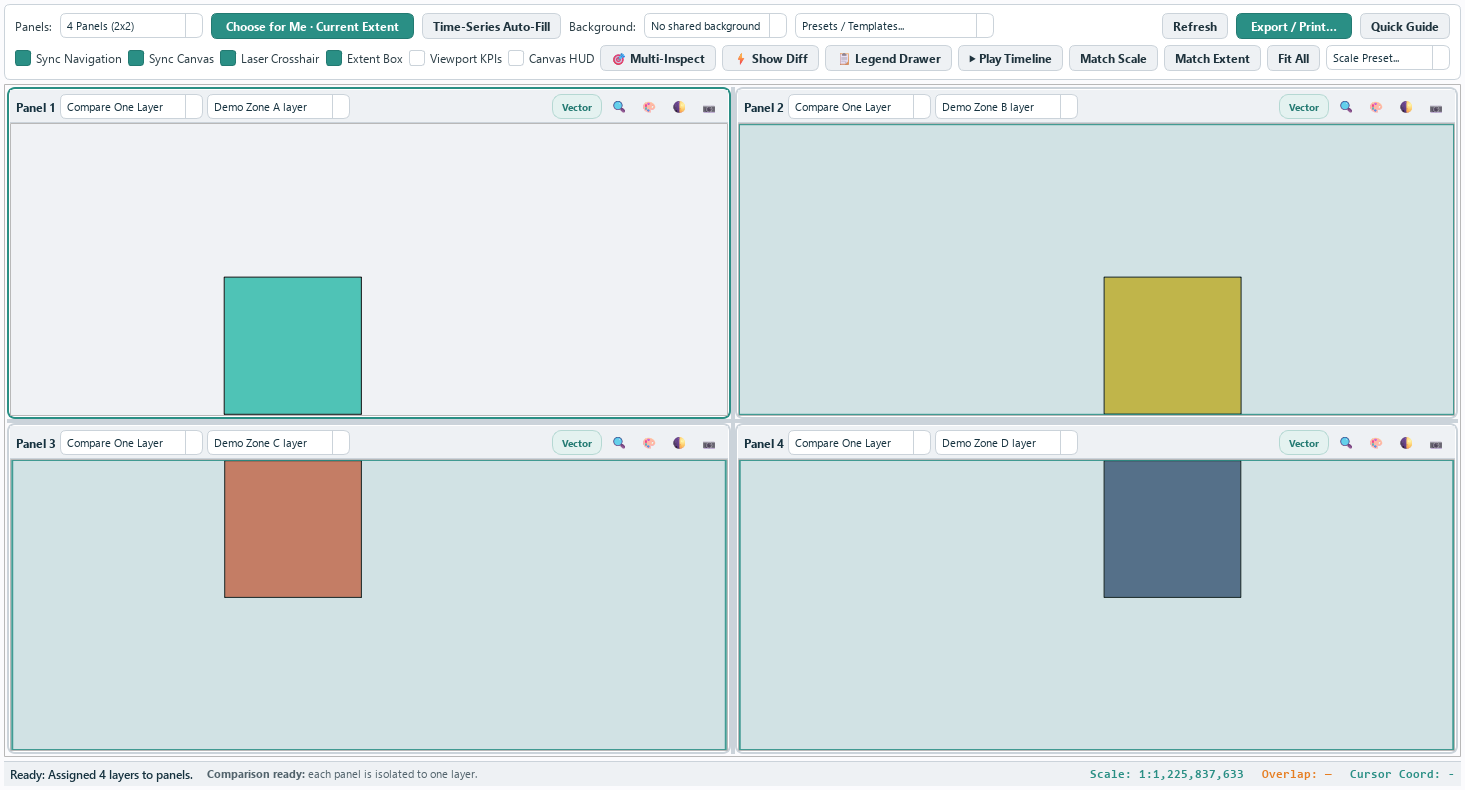
Flexible 2, 3, 4, 6, or 8 panel synchronized viewport matrices in horizontal, vertical, or grid layouts with independent splitter controls.
⚡
Visual Difference Engine
Compute spatial geometry differences between comparison layers. Renders green (added) and red (removed) highlights with live Overlap % ratios and a ground-area breakdown. Layers in different coordinate systems are reprojected before they are compared.
🎯
Multi-Panel Inspector
Click any point on a map panel to query vector feature attributes and raster cell values across all active panels simultaneously.
📊
Viewport KPIs & Canvas HUD
Real-time calculation of visible polygon areas (ha/km²) and feature counts beneath each panel, paired with corner North Arrow HUD graphics. Areas are measured on the ellipsoid, so the readout is the true ground area whatever CRS the layer is stored in.
▶
Timeline Transition Player
Auto-cycle active panel focus or cross-fade timeline layers sequentially across panels for time-series urban growth analysis.
📺
HTML Presentation Dashboards
Export interactive, multi-theme (Slate, Midnight, Emerald) offline HTML dashboards complete with full-screen slide presentation mode.